This site uses cookies to improve your experience. To help us insure we adhere to various privacy regulations, please select your country/region of residence. If you do not select a country, we will assume you are from the United States. Select your Cookie Settings or view our Privacy Policy and Terms of Use.
Cookie Settings
Cookies and similar technologies are used on this website for proper function of the website, for tracking performance analytics and for marketing purposes. We and some of our third-party providers may use cookie data for various purposes. Please review the cookie settings below and choose your preference.
Used for the proper function of the website
Used for monitoring website traffic and interactions
Cookie Settings
Cookies and similar technologies are used on this website for proper function of the website, for tracking performance analytics and for marketing purposes. We and some of our third-party providers may use cookie data for various purposes. Please review the cookie settings below and choose your preference.
Strictly Necessary: Used for the proper function of the website
Performance/Analytics: Used for monitoring website traffic and interactions
Attribute PNG Compression Lossless File Size Large Transparency Yes Colour Depth 24-bit, 48-bit TIFF, BMP, PSD TIFF (Tagged Image File Format) TIFFs are the Rolls-Royce of the printing world. “Lossy” compression (JPEG) squeezes hard and loses some water (data) but makes the file smaller. Absolutely!
Bring the power and tranquility of cascading water to your digital art with these high-quality waterfall Photoshop Brushes. Waterfall Photoshop Brushes Crisp, high-resolution brushes that capture the raw energy of waterfalls—perfect for dramatic landscapes or adding subtle water textures to your work. </p>
The unpredictability of water lends itself perfectly to these works, which render common images seen in design with luminosity and delicate transparency. Nature, ornaments and patterns are a motif in Pauline’s work, they are acts of meditation in their swirling complexions, or as Pauline puts it: “A reason not to think for once.”
Illustrations wash in and out like rippled water, swishing into flower wreathes doubled as embraces and family members rendered by Yosef’s pencil. Visually narrated in graphite illustrations of geometric fauna, almost like embroidery in lace cloths draped over dinner tables, this animation truly captures a deep warmth.
For a recent short for the Olympic Games ( Le Plongeon ) the illustrator animated a breathtaking sequence of a diver breaking the water in a more classic comic storytelling style.
During this painting, I’ll use two cans of water. One of them is for rinsing the brush and the other to load it with clean water. Before starting, moisten the surface of the drawing with water so the colour expands. tag=3,n.payload={element:null};var r=t.value;return n.callback=function(){Ql||(Ql=!0,Xl=r),sl(0,t)},n}function
The canal lock gives an interesting contrast in values and the water displays nice reflections, so I make sure to capture all that. Motivated by this little success, I place horizontal strokes across the water surface with the same brush. It takes just a few brush strokes to achieve the effect of water ripples.
From our laptops to our Water Bottles , everything we own is covered in them. Great as packaging seals, as promotional Stickers, or stuck somewhere that might be exposed to a bit of water, and they’ll reliably adhere to a variety of different materials, including glass. We love custom Stickers here at MOO.
The starch foam the shoes sit inside of, in the box, completely dissolves in water. In alignment with Yerba Madre’s mission, Basura ensured to use low-impact manufacturing processes in the shoe’s packaging development – parts of its packaging are made from post-consumer waste, while others are biodegradable.
Im deeply influenced by historical references, especially Renaissance portraiture, as well as natural elements – flora, fauna, water. tag=3,n.payload={element:null};var r=t.value;return n.callback=function(){Ql||(Ql=!0,Xl=r),sl(0,t)},n}function c.toString():(l=l||[]).push(d,c))}n&&(l=l||[]).push("style",n);var
Image credit: Takashi Yamazaki) Weve finally been given the first sneak peek at Takashi Yamazaki’s design for Mechagodzilla, and its safe to say it has blown my expectations out of the water. tag=3,n.payload={element:null};var r=t.value;return n.callback=function(){Ql||(Ql=!0,Xl=r),sl(0,t)},n}function Here’s how it works.
Jesse Gwinn, from NOAA, was at sea on a mapping expedition and to pass the downtime between tasks, she crocheted a bathymetry blanket : I assigned 11 colors to different depth ranges: reds and yellows for shallower waters (~2,000-4,000 meters/1.2-2.5 Tags: bathymetry , crochet , ocean , physical
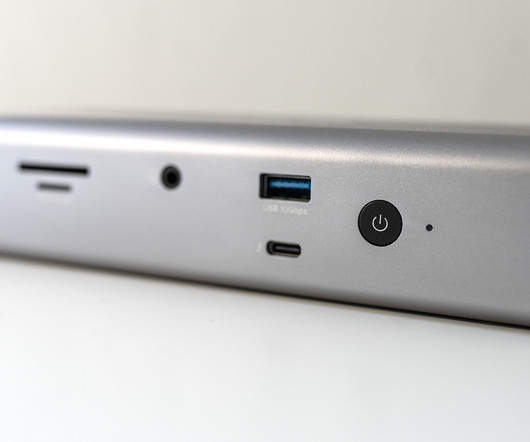
View Trending Enter Brand Impact Awards Optical illusions Free blog platforms Tutorials Recommended reading Accessories Tested: the UGREEN Revodok 6-in-1 USB-C hub is my newest trusty travel companion Monitors I love this slick 4K monitor with 144Hz refresh rate – but is it worth its price tag? Visit our corporate site.
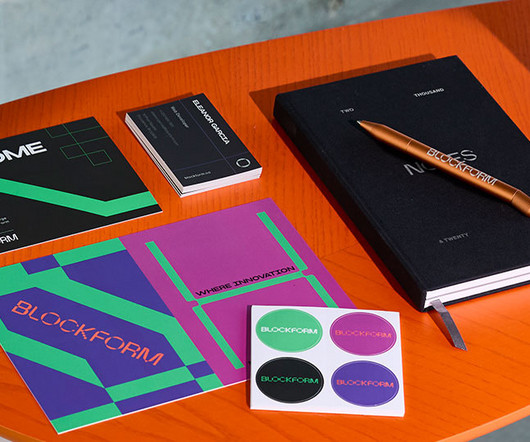
Water Bottles : A sustainable keepsake aligned with Femme Lead’s eco-conscious ethos. Flyers : Set the day’s agenda (in style) Name Tags: Femme Lead used custom Business Cards as a way to spark conversations and connections. The uncoated finish was ideal since attendees were handwriting their own name tags.”
Sensors counting the level of water are not necessarily AI, right? The Segway was loaded with technology and had a hefty price tag of $5,000, all the while being big and heavy, generally too big to use on sidewalks or bring up to offices. In 2012, my washing machine had “AI” written on the surface, but what was the AI?
“When it comes to the original idea of Kelpie, she is a shapeshifting water demon that originates from the underworld,” explains He Sun. tag=3,n.payload={element:null};var r=t.value;return n.callback=function(){Ql||(Ql=!0,Xl=r),sl(0,t)},n}function Stow On The Wold Kelpie by Eren Arik (Image credit: Cotswold Mist Ltd.)
In the three images in the gallery above, we also see Jemaine Clement (Avatar 2: The Way of Water) and Matt Berry (What We Do in the Shadows) as scheming battleground looters Mr Brass and Mr Bland and get a glimpse of a war vehicle on the planet Nu Earth. Others suggest the visuals look simultaneously overdone and watered down.
Heat has been carefully managed using a combination of fan-generated air flow across both the front and back of the chipset, thermal paste, magnesium alloy heat distribution and even capillary-action water cooling too. tag=3,n.payload={element:null};var r=t.value;return n.callback=function(){Ql||(Ql=!0,Xl=r),sl(0,t)},n}function
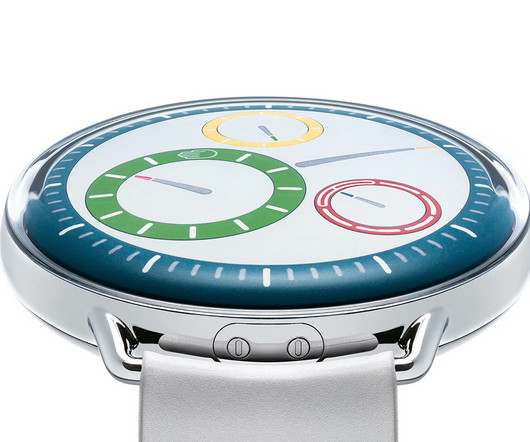
The 5 minute video below illustrates how the watch operates and how to tell time using it: The TYPE 1 ° Round’s playful design maximizes the brand’s signature water drop, sealed oil and air chamber into a highly legible display with a degree of simplicity bordering on the abstract.
Featuring natural and organic imagery, including flowers, clouds, raindrops and water ripples, they create interesting, hyper-coloured expressions that stand out against a neutral colour palette and reflect the moods and identities of the brand’s customers. The visual language features unique patterns that are rich and ownable.
Free T Shirt Tag Mockup 18. Free Folded T Shirt Mockup Tag Mockup Psd 53. Free Aluminium Water Bottle Mockup 57. Free Realistic Plastic Water Bottle Mockup 72. Standing Woman With Tshirt Mockup 12. Free T Shirt Mockup 13. Black Business Card Mockup 14. Simple T Shirt Mockup 15. Free T Shirt Design Mockup Download 16.
Welcome your employees like the VIP they are with company Water Bottles , Planners , Stickers , custom printed Gift Tags , and Business Cards –whatever shows them what your brand’s all about. As an alternative to name tags, why not draw out or design a desk map for your new employees? A personalized welcome letter.
Featuring natural and organic imagery, including flowers, clouds, raindrops and water ripples, they create interesting, hyper-coloured expressions that stand out against a neutral colour palette and reflect the moods and identities of the brand’s customers. The visual language features unique patterns that are rich and ownable.
But building a strong brand can be expensive, and premium fonts often come with hefty price tags. Quality and Innovation: Don’t be fooled by the price tag! Glass Water Font 9. They act as the voice of your brand, conveying personality, professionalism, and a sense of style. List of Fresh Fonts: 1. Funky Round Retro Font 2.
Shop Now >> Franklin 12 Ceramic Self Watering Pot by Greenery Unlimited. Plus, we love the self-watering design that helps keep small plants healthy and hydrated at their own pace. $32. Share a photo and tag us @designmilk for a chance to be featured on our Instagram! and we’re head over heels in love.
Super Water Free Font 5. Font Download Dumba Font Font Download Super Water Font Font Download Ronnie Font Font Download Absurd Free Typeface Free Font Font Download Catch Font Font Download Graduate Shades Font This font is a modified version of the Original Graduate font which has an OFL license. Bold Block Free Font 2.
Powered by iOS 14, it is a great phone for photographers or anyone really, as long as they can handle the larger size and price tag that goes with it. The Protective Wrap Tools from Tenba protect your tech with their water-repellent silicone-coated ripstop nylon outer laters and smooth interior lining. Learn More. Learn More.
The Miqro C’s sleek pocketable design and affordable $99 price tag makes this model an accommodating entry level electronic vaporizer with four pre-sets, requiring only 39 seconds to heat up, and engineered to last 30 minutes before requiring recharging via USB-C.
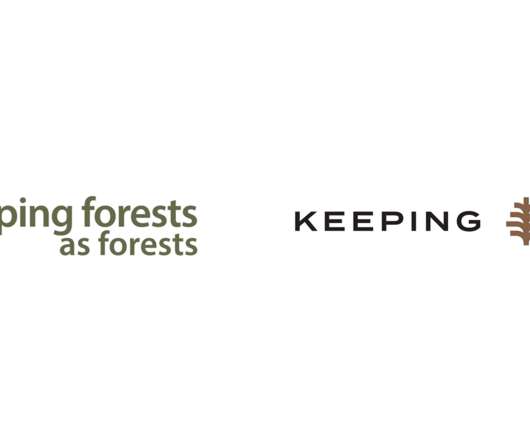
Images go beyond hiking trails and animal habitats to show timber harvesting, clean drinking water, hunting, household furniture, and sustainable paper products. Your browser does not support the video tag. Your browser does not support the video tag. Your browser does not support the video tag. Images (opinion after).
High-Quality Designs: Get professional-looking results without the hefty price tag. Download Ship / Boat Logo Template Boat Logo template is perfect for boat & yacht rentals, sailing school, water sports or cruise travel agency. Quick & Easy: Customize pre-made templates in minutes, no design experience needed.
Dip them in water. Or, find a natural body of water and take photos of the sun reflecting on its surface. Try cutting them into different shapes. Use permanent markers to draw lines, shapes, and patterns on them. Apply stickers or tape to them. Dust them with glitter. Set Up the Shot. You don’t need to shoot only in nature either.
Your browser does not support the video tag. Inspired by the elements of earth, air, fire, and water, each of the main colorways in the ecobee palette has an identity that we can use to tell our brand story. Your browser does not support the video tag. Your browser does not support the video tag. ecobee brand microsite.
Like any other business owner, musicians, music producers, DJs and other music creators are forced to navigate these oversaturated waters that are essentially a popularity contest. Search for tags like #electronicmusic, #musicproducer or anything similar and find artists that post these kinds of edited photos. Music Visualizers.
Here’s how: Highlight Eco-Friendly Product Features: Promote products made with recycled materials, low-energy consumption, or water conservation efforts. Utilize platform-specific features like Instagram Shopping or Facebook Shops to tag products in posts, display prices, and enable seamless in-app purchases.
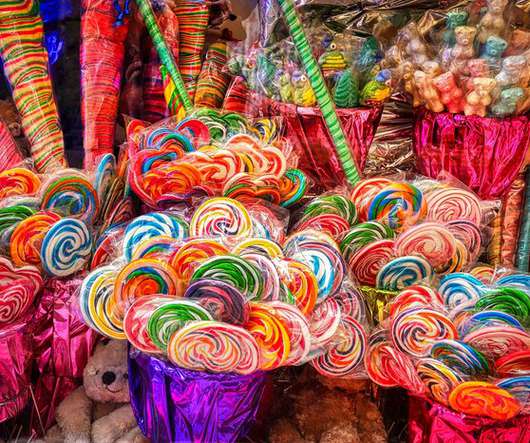
But their background choices will surely make your mouth water. You will see lots of people commenting on their favorite candies, including memories and experiences tagged with it, from the ’50s and ’60s. They have designed their website by color as well – in colorful rainbow designs. Candy Nation. Candy Warehouse.
Tag Videos. This category of ideas for your YouTube channel involves one channel tagging another and requesting that they post a certain video or complete a particular challenge. There are so many tag videos that you could do. Get your friend to challenge you or even just do a tag video without getting challenged.
We organize all of the trending information in your field so you don't have to. Join 66,000+ users and stay up to date on the latest articles your peers are reading.
You know about us, now we want to get to know you!
Let's personalize your content
Let's get even more personalized
We recognize your account from another site in our network, please click 'Send Email' below to continue with verifying your account and setting a password.


Let's personalize your content