This site uses cookies to improve your experience. To help us insure we adhere to various privacy regulations, please select your country/region of residence. If you do not select a country, we will assume you are from the United States. Select your Cookie Settings or view our Privacy Policy and Terms of Use.
Cookie Settings
Cookies and similar technologies are used on this website for proper function of the website, for tracking performance analytics and for marketing purposes. We and some of our third-party providers may use cookie data for various purposes. Please review the cookie settings below and choose your preference.
Used for the proper function of the website
Used for monitoring website traffic and interactions
Cookie Settings
Cookies and similar technologies are used on this website for proper function of the website, for tracking performance analytics and for marketing purposes. We and some of our third-party providers may use cookie data for various purposes. Please review the cookie settings below and choose your preference.
Strictly Necessary: Used for the proper function of the website
Performance/Analytics: Used for monitoring website traffic and interactions
This article will provide you with a step-by-step guide on how to craft an innovative resume that captivates potential employers, making a lasting impression. This section will explore different formats, such as chronological, functional, combination, and infographic resumes.
You may be interested in the following related articles as well. has all the features you’d expect in a professional brochure template, from placeholders, to text styles, customizable infographics, and easy to edit master pages. Easy to use and very customizable, every download included help files. Download Link. Download Link.
Interested in reading more articles regarding copyright? Here are some helpful articles to learn more: A Guide to Copyrights, Trademarks, and Patents in Print and Beyond. The post COPYRIGHT 101 [INFOGRAPHIC] appeared first on UCreative.com. Don’t dilly-dally and get yourself and your intellectual property protected today.
Color Lisa Color Lisa is a curated collection of color palettes inspired by the artwork of famous artists and designers, with suggested color codes for each palette. Free Infographic Tools: 66. Canva Infographic Maker Canva Infographic Maker is a tool that allows users to create professional-looking infographics quickly and easily.
Minify your website’s code. Use Infographics. Organize your website information in concise and easy to read infographics to keep your web page informative and appealing. A compelling infographic can keep a visitor on your website. Ideally, your website should load within three seconds. Optimize your image size.
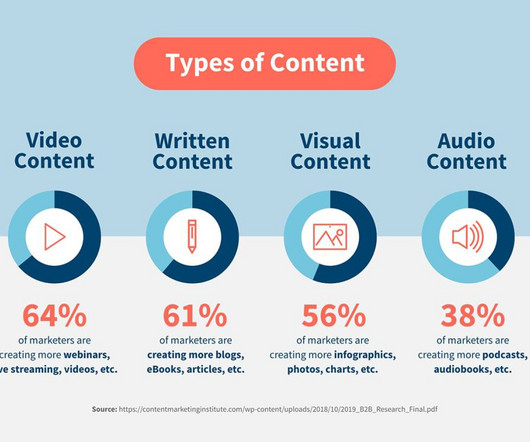
This is a guest article contributed by Tom Buckland. Many people are visual learners, and videos, infographics, data tables and more can be much more effective in converting these users. 2) Visual content and infographics are often linked to by other sites, creating a whole new avenue of traffic. Having the Wrong Logo.
For example, if the design of the website, including the colour scheme and infographic placement, is suitable for mobile versions alongside computers, you have a better potential to revamp traffic. Moreover, for those website owners whose website is not ready to launch in the marketplace, they can put codes of their website instead of URLs.
Although coding and IT skills are vital for web development, there are some basic design ideas that have to be taken into account too. Infographics are more than mere pie charts, histograms, or bar graphs. There are some rules that can be applied to any type of visual design, and infographics are no exception. Intuitive Design.
This article has been contributed by Katarina Raguž. It is no longer feasible to use Flash for coding your website – it makes websites heavier and they take forever to load and besides, Flash is no longer compatible with all devices as many are ending their support for Flash content in 2020. Image source: Outbrain.
Whether you’re working on a new page or redesigning an existing one, a clean, SEO-friendly code is necessary. Building on your site’s code and reducing clutter can help optimize your page load times and assist in search engine ranking. Apply best practices when it comes to coding your pages. 6) Aesthetic User Interfaces.
I hope this article gets the creative juices flowing! Give them a helpful infographic. A useful infographic can feel like a lifesaver when you see it. A fantastic infographic has the potential to be shared on social media or forwarded to friends, so try to present the information better than anybody else could.
This article has been contributed by Freya Kuka. No employee wants an article with a due date of tomorrow being thrown at them. Every article your team is putting time and effort into creating should have a focused keyword you are targeting. If you have a team, it will keep them focused and on the ball. A Pull File.
Data Visualization VS Infographics: 5 Main Differences. Renting & Salary Statistics Infographic by Natalie Zuieva. Infographic Data Visualization by Madeline VanRemmen. Data Visualization VS Infographics. It is often you search for infographics and find images titled Data Visualization and the other way around.
BTW I have published this as an article, a presentation, a video and a set of posters only. So if the image is an infographic that conveys a key point, summarise that point, or if it is brand furniture, in other words it is just there for aesthetic purposes, then it can remain silent. Time coded metadata.
This article has been contributed by Kevin George. If you want to learn more about these design trends, check out the infographic below created by our friends at Email Uplers: 11 Email Design Trends That Will Reign Supreme in 2021. _. Many aspects of professional and personal lives have changed over the past year.
Web Development Tools: 1 – Visual Studio Code Visual Studio Code (VS Code) is a popular and highly versatile web development tool created by Microsoft. It is a lightweight, open-source source code editor that supports multiple programming languages and runs on various platforms like Windows, macOS, and Linux.
The brand book can take a more holistic approach to guidelines, so rather than listing color codes, font types, logo concepts, etc., You could develop design guidelines that include your brand’s colors with samples, HEX, and RGB codes. If you only take one thing away from this article, this should probably be it.
They usually include: Logo files Logo usage rules Approved fonts & sizes Official colour codes Design element libraries Visual examples Creating brand style guides is a higher-value service that goes hand-in-hand with logo design. InfographicsInfographics visually communicate information, data and ideas to readers more engagingly.
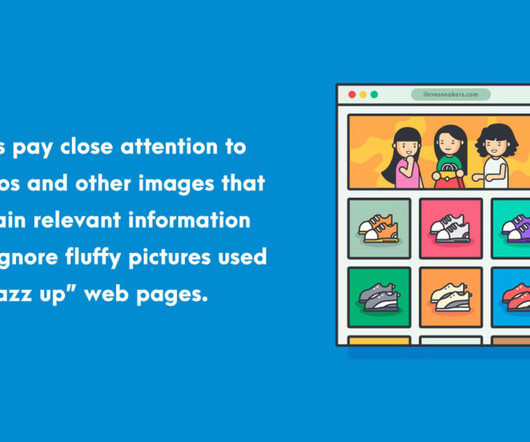
Articles with relevant images get 94% more views than wall-of-text. Infographics Distill Data Clearly Dumping endless statistics overloads readers. Infographics artfully distil volumes of data into compelling visual representations for fast comprehension. Robust graphic design makes impressions.
In this article, I will tell you how to design during a crisis. We are making content for news: visuals, infographics, posters and websites. This is the 7th day of the war in Ukraine and in this article, I have collected all the life hacks that I have figured out myself during this time. Hello, my name is Andrey.
This picture library will contain everything from stock photos to original artwork from your team, such as infographics , diagrams, and more – all in one place from inside the software. If you know how to code, you can customize it according to your needs and take it to a higher level. What is the Best Graphic Design Software?
The ready-made also offers an intuitive and user-friendly admin panel, clean coding, and advanced theme options. Besides, it also offers a rich gallery, a convenient admin panel, and clean coding. Composed with Cherry Framework 3 builder, the asset boasts clean and semantically valid coding. Professional Acadam.
Whether it’s solving coding problems or understanding the realms of web development as a whole, ChatGPT can be quite the ally. In this article, we’ll explore some useful scenarios and prompts, complete with examples, that developers can use to communicate with ChatGPT and get some pretty useful answers. Get a demo with code.
In the following article, we'll walk through the top web tools for designers in 2024. Here are the leading options: Canva The web-based graphic design platform Canva makes light work of creating stunning social media posts , presentations, posters, reports, infographics, and other visual materials. Can I animate designs without coding?
If you are a relative novice in the field of UI/UX design or even if you are more experienced and looking at options for changing or adding to your preferred UI UX software design package, then this article is absolutely aimed at you. Take a look at our UI/UX Design Software Infographic Comparison. Hype 4 UI UX Design Software.
The theme enhances your site’s visibility on search engines with built-in Schema.org code and AMP compatibility. Customization is a breeze, even for those without coding skills, thanks to features like Featured Content, Slider, Hero Content, Portfolio, Services, and Testimonials that elevate your site’s functionality and look.
It is known for its animations, cartoons, and infographics, which help the user to create more interactive presentations and explainer-style videos. Piktochart allows you to make infographics, presentations, and printables quickly. But why not check our free infographics as well? Example by Focusky. Piktochart.
Visual: Videos, graphics/presentations from SlideShare/infographics/handouts/templates/checklists etc. Co-host a webinar; contribute a quote to their article; invite them to guest post on your site, etc. Audio: Podcasts/audio guides/interviews/roundtables/etc. Other: Webinars/courses/assessments/tools The sky's the limit!
Now, keep reading this article to learn about the best online chart maker in 2021. Pictorial Bar charts are visual representations of bar graphs used by designers in infographics. For example, create your own QR code, barcode, map, organization chart, etc. create your own QR code, barcode, map, organization chart.
This could be a video, an article, an infographic , or a picture. For instance, viewing this article on a smartphone, you would see the website on full-screen. You must remember that users don't like reading long articles. In this article, we'll present some ways to build an influential community on your website.
If interested, check out our article on how to download Illustrator free. You can get 10% off your first year with code ‘JUSTCREATIVE10’ and read our Looka Logo Maker review. Get an exclusive 10% discount with coupon code ‘JUST10’. And if you’re not ready to commit, you can try it out with a 7-day free trial.
Note: Throughout this article, I use the terms product design, UX, and design interchangeably. It is how our designs become real, how designs get translated into code and published on the Web and in App Stores. John Cutler's infographic below illustrates the difference in product teams. References SAFe 5.0 References SAFe 5.0
An Elementor page builder is an easy-to-use and intuitive tool for building web pages with no coding skills. You don't have to code. This means no coding skills or knowledge is needed. Some Elementor addons might add a lot of code to your website, and this may slow it down and affect its overall performance. and so on.
To the outside world, building websites, creating marketing posts, and designing infographics may seem easy. Such development tools as Chrome DevTools allow you to optimize the speed of websites, inspect messages, and run JavaScript codes, while GitHub enables developers to view changes they make and revert to previous versions when needed.
This can be an ebook, checklist, or infographic. These can be lead magnets like ebooks, guides, checklists, infographics, cheat sheets or toolkits. The thank-you page is also where users download your lead magnets or get offers like a coupon code. Choose what fits best with your business and is most helpful for your users.
A few notes: Many of these tenets can be found explicitly within the Web Content Accessibility Guidelines, and I I developed my training by drawing a great deal of inspiration from articles I found published in the UX Collective here on Medium. This training?
The goal was to develop a new open-source video coding format that is both state-of-the-art and royalty-free. It offers better support for graphical elements, logos, and infographics, where JPEG has limitations. Note: Image CDNs are mentioned a few times in this article. It calls Rust code in the browser using a WebWorker.
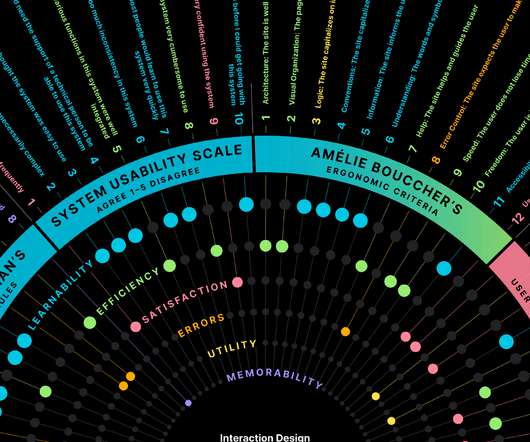
Going beyond Nielsen’s Usability Heuristics (with Infographic) In this article, I explore, categorize, and standardize heuristic evaluation methodologies and data visualization to help inform which method to choose. Full heuristics are detailed at the end of this article.
This infographic provides a number of examples of how you can make your writing clearer. Often recognized as the Bible of content creation, founder Brian Clark’s site features hundreds of insightful and easy-to-read articles on all things content related. Browse the blog for articles that communicate valuable tips clearly and quickly.
Interface design; Coding of the websites; Creation of content; Search engine optimization of websites; Creation of chat-bots; And a lot of other cool features. This AI extension helps you create human avatars, which you can present as authors of your articles or employers that can give a rapid response in chat as support.
How to Create A WordPress Music Band Website Without Coding Skills (10 Easy Steps). To work confidently with WordPress, one doesn't need any coding skills or knowledge of web design. How to Create A WordPress Music Band Website Without Coding Skills (10 Easy Steps). #1. About Music Band Websites.
Think of it as a secret code only you and your dream client understand. Here are a few tips to help you arrive at the perfect blog name without resorting to just adding “blog” at the end of your name (seriously, don't do that): First, read books or articles in your niche. Then, we have infographics.
You can learn more about kerning through this article, A beginner’s guide to kerning like a designer. Have you ever struggled to get through an otherwise interesting magazine article? Use the right alignment for your infographic and let the details read better, just like the Pink and Brown Modern Beauty Skincare Infographic template.
coding, website design, and content creation). Ensure you include valuable resources such as infographics, interactive content, and other forms of text that are rich in information for your readers. And to ensure your content stays fresh, it's vital to read regular articles. 20 – Run Retargeting Campaigns.
We organize all of the trending information in your field so you don't have to. Join 66,000+ users and stay up to date on the latest articles your peers are reading.
You know about us, now we want to get to know you!
Let's personalize your content
Let's get even more personalized
We recognize your account from another site in our network, please click 'Send Email' below to continue with verifying your account and setting a password.


Let's personalize your content