Remove tag covid-19
article thumbnail

A catalog of all the Covid visualizations

FlowingData

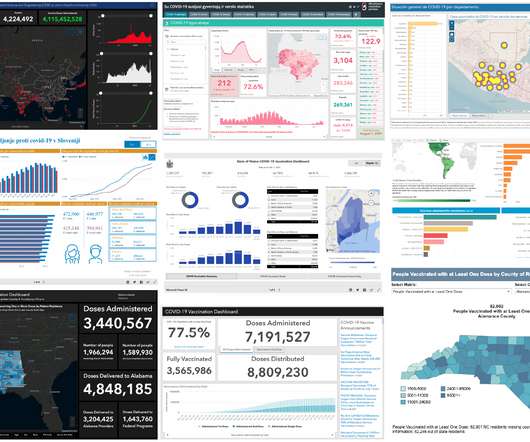
The COVID-19 Online Visualization Collection is a project to catalog Covid-related graphics across countries, sources, and styles. Tags: collection , coronavirus. They call it COVIC for short, which seems like a stretch for an acronym and a confusing way to introduce a project to people.

Graphic 133
article thumbnail

Data recorded in fabric quilt

FlowingData

Kim Moran-Jones quilted temperature minima and maxima in the UK , along with Covid-19 deaths on the perimeter in grayscale. Tags: coronavirus , Kim Moran-Jones , physical , quilt. Data and the physical fit well together.

Art 137
Insiders

Sign Up for our Newsletter

This site is protected by reCAPTCHA and the Google Privacy Policy and Terms of Service apply.

Trending Sources

article thumbnail

Covid-19 mortality before and after vaccine eligibility

FlowingData

Denise Lu and Albert Sun for The New York Times show the shifts in Covid-19 deaths among different demographic groups : The change in death rates among groups is starker by race and ethnicity, and the death rate has risen particularly sharply for middle-aged white people. Tags: coronavirus , New York Times.

Color 108
article thumbnail

A go-to guide for creative support during coronavirus

Creative Review

Artists in lockdown can video chat with the agents at Handsome Frank, who are doing video portfolio reviews with anyone that sends them a link to their work, tagged with #hfreview. Portfolio reviews with illustration agency Handsome Frank. Junior creative book reviews. Contact him to be added. Marguerite’s Freelancers Unite.

Portfolio 125
article thumbnail

Rate of change in Covid-19 cases

FlowingData

We’re all familiar with the Covid-19 line charts that show cases over time, which highlights absolute counts. Tags: baseline , change , coronavirus , STAT. There are peaks. There are some valleys.

123
123
article thumbnail

Using rates for more relatable Covid-19 numbers

FlowingData

With millions of Covid-19 deaths worldwide, and hundreds of thousands in the US, the absolute counts have been a challenge to relate to for a while. 1 in 500 Americans died from Covid-19 so far. Tags: coronavirus , rate , scale , Washington Post.

88
article thumbnail

A flag planted for every Covid-19 death

FlowingData

In fall 2020, Suzanne Brennan Firstenberg planted a flag for each American who died from Covid-19. Tags: coronavirus , flags , physical , Suzanne Brennan Firstenberg. There were over a quarter of a million flags at the time. The art installation is back at the National Mall, but this time there are over 660,000 flags.

Art 120