This site uses cookies to improve your experience. To help us insure we adhere to various privacy regulations, please select your country/region of residence. If you do not select a country, we will assume you are from the United States. Select your Cookie Settings or view our Privacy Policy and Terms of Use.
Cookie Settings
Cookies and similar technologies are used on this website for proper function of the website, for tracking performance analytics and for marketing purposes. We and some of our third-party providers may use cookie data for various purposes. Please review the cookie settings below and choose your preference.
Used for the proper function of the website
Used for monitoring website traffic and interactions
Cookie Settings
Cookies and similar technologies are used on this website for proper function of the website, for tracking performance analytics and for marketing purposes. We and some of our third-party providers may use cookie data for various purposes. Please review the cookie settings below and choose your preference.
Strictly Necessary: Used for the proper function of the website
Performance/Analytics: Used for monitoring website traffic and interactions
Producing infographics is one of the greatest methods to attain this aim. Infographics are one of the most common ways to graphically convey and distribute information. Infographics are also graphical representations of complicated facts. Creating infographics takes careful consideration. Come up with a great idea.
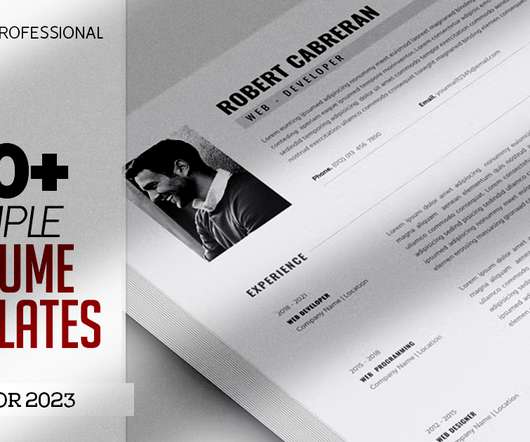
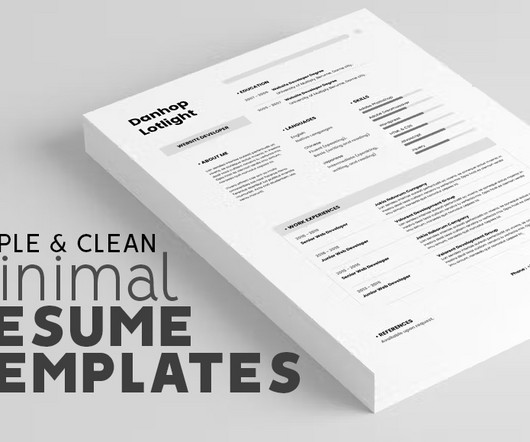
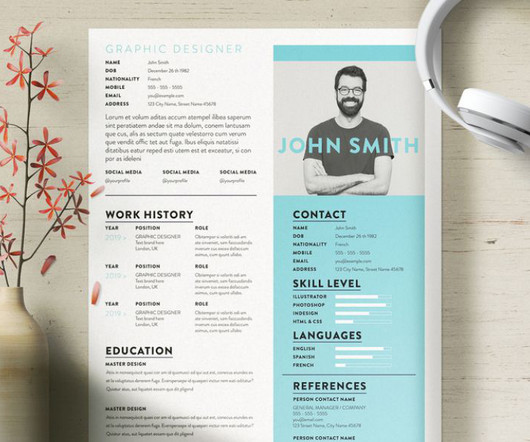
Present your resume and cover letter professionally, with subtle visual details, and simple infographics and icon options. It includes multiple color versions, infographic features, paragraph styles, easy to use files, and is set with free fonts. Clean, Creative Resume Template. The Resume Modern Design.
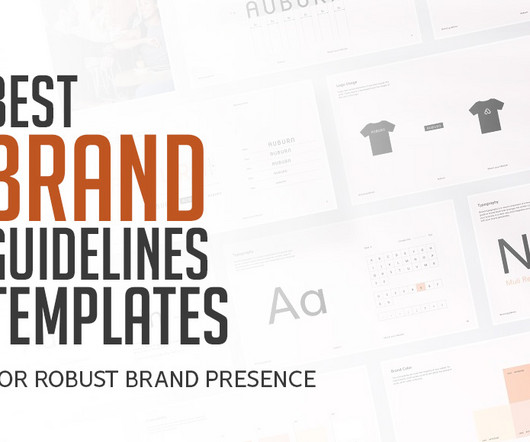
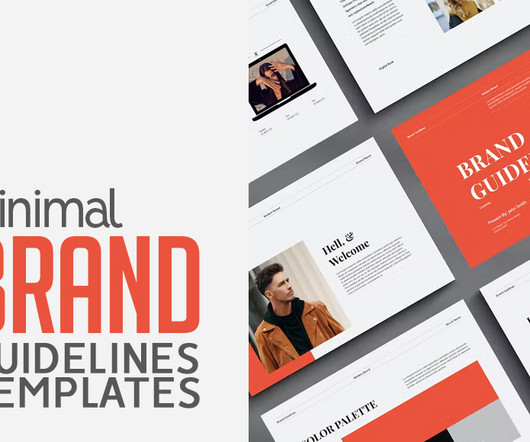
Brand guidelines templates, often referred to simply as brand guidelines , are comprehensive documents that articulate the essential elements of a brand’s identity. Brand Guidelines Presentation Template 11. Download Brand Guidelines Presentation Template Print as or export and send to clients as a pdf.
In these templates color schemes to typography choices, designers can easily reference the guidelines to maintain visual consistency while exploring creative variations. With its master slide layout and 40 unique slides, customization is effortless, allowing you to craft polished and professional presentations in minutes.
Timeline infographics are everywhere. I’m going to share a five-step process for creating your own timeline infographic. First, let’s take a step back and get a better understanding of timeline infographics. First, let’s take a step back and get a better understanding of timeline infographics. Does that sound about right?
System is a modernist, neo-Grotesk sans family influenced by wayfinding infographics in European and US art galleries. Its apertures present a crisp and rigid style that evokes a utilitarian look, while experimenting with some of Binate's lower hooks can give your designs an approachable and friendly feel. System by Frost.
For additional guidance, refer to the accompanying template for valuable tips. Download Minimal Cv Resume Template Download Difference between Modern & Minimal Resume Templates Modern and minimal resumes represent two distinct approaches to presenting professional qualifications and experiences.
They have a comprehensive exhibition of infographics and representations that have been made with the public form to fill in as motivation for the individuals who are keen on making their own. You can clearly see that many things are present in this tool, making it a perfect fit for any company that works with marketing. Gantt Chart.
For example, you are free to download PSD templates, logos, corporate identity styles, illustrations, social media templates, product mock-ups, infographics, UI elements, and other tools. Do not forget about presentation templates for PowerPoint, Keynote, and Google Slides. It is also possible to get HTML and CMS templates.
You must plan to create an infographic. Because infographics have become the most effective and popular way of business communication, and one of the most shared and favorite content on social media. Because infographics can not only make you a visual focus but also easy to digest. What is an infographic?
Asymmetry refers to a design principle where elements are deliberately unbalanced. Art Movement: While less common, the title could refer to an artistic movement that embraces asymmetry. but the way we present it is evolving. The title could signify a growing appreciation for this approach.
People are likely to interact with your stories when the presentation is this awesome. Arrange your beneficial information into tiny parts and present them with this elegant yet straightforward carousel template. Learn More Koepie – Vector Business Model Canva Is your next big business presentation around the corner?
If you need to make a presentation, you want to give yourself the best chance of success. To sell the product or yourself, to inform, to get your message across – the better the presentation the better the chances. Slide show presentations are a common way of doing this, but they are no less useful for that.
It includes sections for personal details, professional summary, work experience, education, skills, projects, and references. The organized presentation allows you to present your achievements coherently and showcase your potential as a valuable asset to any organization.
The usability of a website refers to its ability to support intended tasks. Website usability entails the concise presentation of information and usability features. Accompany your written content with photographs and infographics to capture your readers’ attention. But first things first, what is website usability?
You can instantly add animation to social media posts, presentations, or anywhere else you need to make a stunning visual impression. Image credit: Visme Best animation software for basic infographics Platform: Windows, Linus, macOS (Operates Online) Pricing: US $29.00 Mango Animate. Crello Crello.
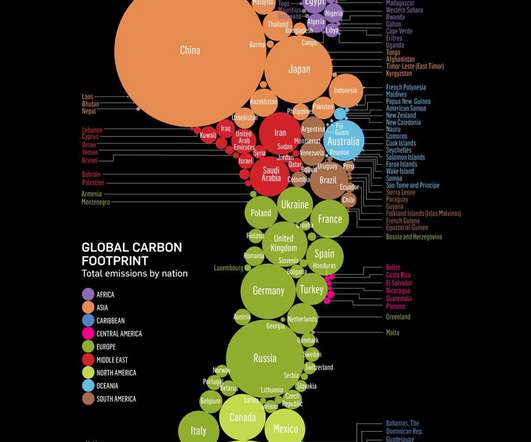
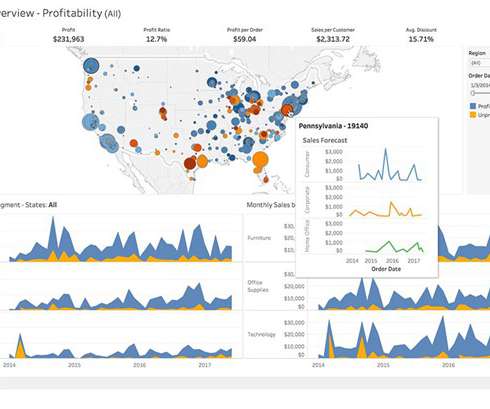
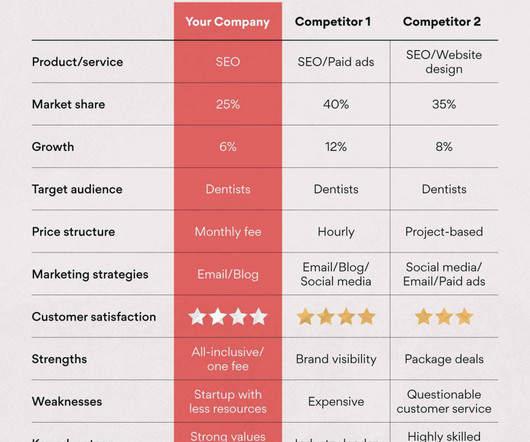
To create data visualization in order to present your data is no longer just a nice to have skill. Data Visualization VS Infographics: 5 Main Differences. Presentations. Renting & Salary Statistics Infographic by Natalie Zuieva. Charts present data in the form of graphs, diagrams, and tables. How Does it Work?
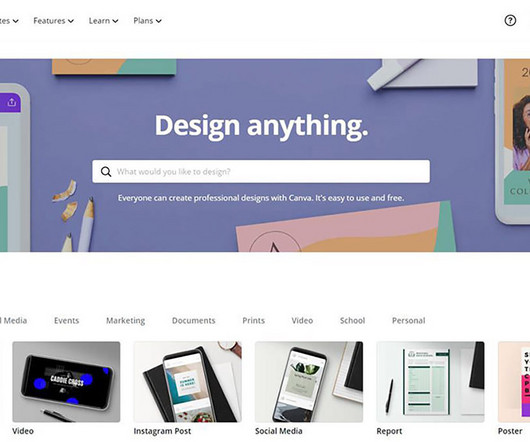
Canva.com — A web-based design platform that allows users to create professional-looking graphics, presentations, and marketing materials with easy-to-use templates, drag-and-drop tools, and a vast library of images and design elements.
It usually refers to a webinar, an online class or workshop, a panel discussion or a virtual conference. A webinar (a portmanteau of “web” and “seminar”) is an online lecture or presentation. Webinars and online classes are usually (though not always) taught by a single presenter. Types of Virtual Events.
A Minimalist PowerPoint Solution for Professionals Designed by Rocketstill, the Evox presentation template offers a refined, minimalist approach to professional presentations. Developed with business presentations, lookbooks, and project pitches in mind, this template stands out for its simplicity and versatility.
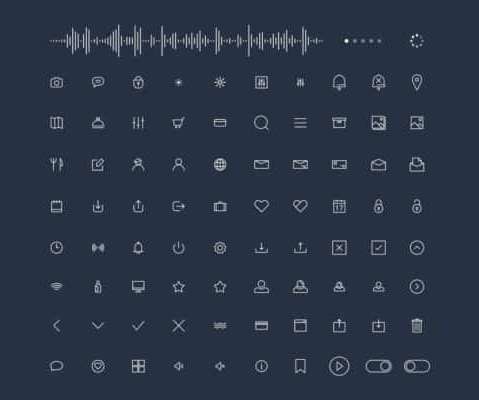
Available in normal spacing, the Wirebet font is an excellent fit for creating visualization projects or web concept presentations, with or without using graphic software. You will also get a cheat sheet that can be used for quick reference. You also get an icon font pack that includes TTF, SVG, EOT, and WOFF files. Download Now.
Each of these design elements contributes to the overall presentation of your poster: 1. Once you’ve decided on a base color, you can then choose a color scheme by referring to the color wheel to see how each color relates to one another. It will also make an impact and prompt the right action from your target audience.
Using infographics to simplify complex information Utilising infographics is a powerful strategy for simplifying complex information and making it more digestible for your audience. So, infographics offer a visually engaging solution that enables you to convey key messages quickly and effectively!
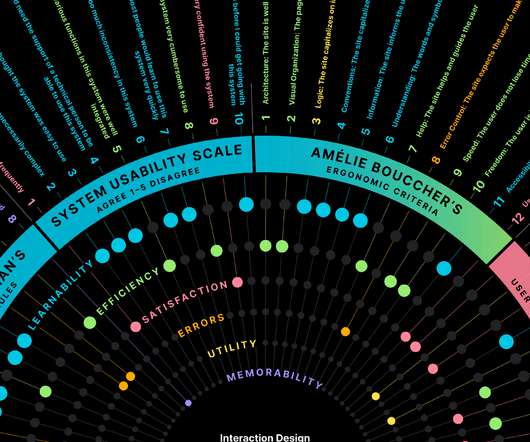
Going beyond Nielsen’s Usability Heuristics (with Infographic) In this article, I explore, categorize, and standardize heuristic evaluation methodologies and data visualization to help inform which method to choose. A key one is utility, which refers to the design’s functionality: Does it do what users need? Mix and match heuristics.
Presentations are a powerful tool for sharing new research findings within scientific communities, educating colleagues and junior staff members about critical new techniques, and promoting your medical career. Why Use Medical PowerPoint Templates For Your Presentations? Every presentation requires a lot of planning and work.
As motion graphic artists, you need to deep dive into your character details and storyboards outlines that refer to your entire motion animation. Motion graphics refers to the alluring animated videos or gifs. Straight lines are faster to make the character, and curves refer to the calm vibes.
It could be in-depth articles, comprehensive guides, research papers, or interactive infographics. Providing unique insights, updated information, or presenting the content more engagingly can make your page more link-worthy. Next, seek opportunities to acquire similar high-quality backlinks for your website.
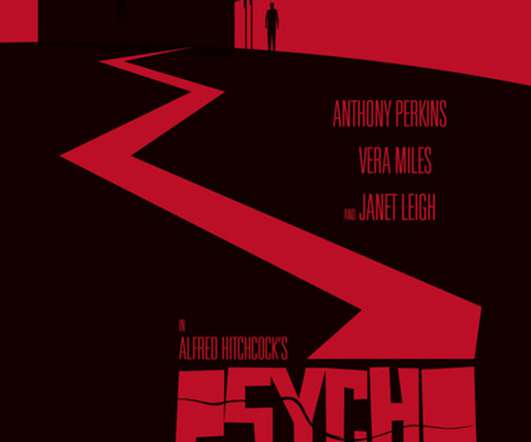
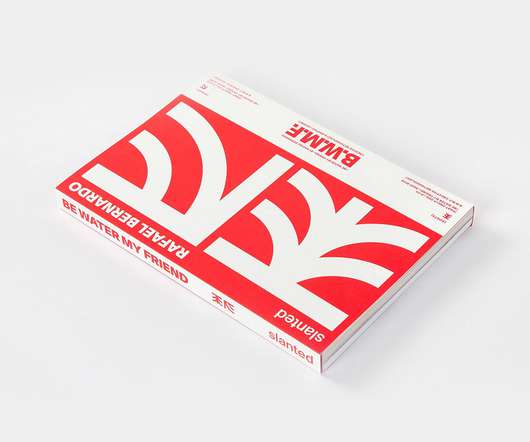
abduzeedo 0127—22 Inspired by an interview with Bruce Lee, where he refers to an aspect of Taoist philosophy, that water can teach us “the way,” the graphic designer, creative activist, lecturer, author, and founder of the eponymous studio for branding communication Rafael Bernardo started to wonder whether he “was water” in his creative workflow.
You can use it as a presentation app to make and present slides. You can also use it to create templates for infographics. It has numerous templates for presentations and marketing. It helps teams to collaborate to work on creating presentations and data visualizations. Premium Plan: This plan is $25 per month.
Types of Blog Posts Listicles How-to Guides Infographics Interviews Case Studies Reviews Guest Posts Personal Stories Round-Up Posts Comparison Posts Newsjacking Posts Behind-the-Scenes Content Video Posts Podcasts Checklists Listicles Listicles are blog posts that list several items around a specific topic. Choose a unique design.
Helpful Tools Storybook – Display components with code for developers Pattern Lab – Create atomic design systems and pattern libraries Lucidchart – Collaborative diagramming for wireframes or sitemaps Centralised references prevent duplication of efforts and disjointed properties.
60% of millennial consumers expect consistent branding across all marketing channels and 91% of consumers would rather buy from an authentic brand – so it is, in fact, important to have a well-defined brand and to present its messages in a similar format all the way through from the first customer interaction to the purchase and beyond.
From infographics to blog posts , every piece of content directly represents your business, so you need to be sure it’s hitting the mark. Infographics. If you’re unsure what a sales funnel looks like, refer to the below infographic. Infographics are one of the easiest and best ways to communicate information.
Studies have shown that people are more likely to remember information when it's presented with relevant visuals. Similarly, infographics and charts can help present complex data in an easy-to-understand format. Composition Composition refers to the arrangement of elements within an image.
. – thus increasing recognition/recall by showing these same visuals over & again via various formats/platforms/channels, e.g., On web page, brochures and promoting products/services via videos / animated gifs, sharing exciting facts/tips/infographics posts on social media platforms etc.
Good visual storytelling is often referred to as marketing design, but it's much more than just designing the message. You could use an image to highlight a piece of content, like an article, blog post, or infographic. Ensure that images complement the written word and other media types, such as videos or infographics.
But how you present those ideas on this crowded internet marketplace makes all the difference. So, when discussing good design in content marketing, we’re referring to making every single first impression count. Imagine it: Wouldn’t it be easier to make that visually stunning infographic if you had planned the design and content?
These typefaces lack the decorative strokes (or “serifs”) found at the ends of letterforms, leading to a clean and modern presentation. Uses : Websites, infographics, and presentations. Uses : Mobile apps, marketing materials, and infographics. Uses : Infographics and branding.
It refers to the physical and visual qualities of a surface. Hierarchy is significant in details like websites, infographics, or presentations. Rhythm is fundamental in designs that have a sequential or linear nature, such as websites or presentations. It creates a sense of balance and harmony between elements.
This picture library will contain everything from stock photos to original artwork from your team, such as infographics , diagrams, and more – all in one place from inside the software. Grid for reference or snapping: Grid lets users have full control over editing.
One way to achieve this is by incorporating visuals such as images, videos, and infographics into your social media posts. Infographics are a powerful way to present complex data and statistics in a visually appealing and easy-to-understand format. Videos, on the other hand, offer a more immersive and interactive experience.
Content Repurposing refers to using existing social media content and presenting the same in a new format. Content repurposing refers to the concept wherein you lease a new life to the content. Reworking on present written content. You can even create infographic content based on key statistics sourced from an Ebook.
Piktochart: A tool for creating infographics, presentations, and other visual content. Best Tools to Help with Brand Storytelling Prezi: Prezi is a dynamic presentation tool that enables you to create engaging and non-linear presentations, making it useful for storytelling in branding.
Furthermore, understanding your audience's preferences is vital to present your marketing materials in a manner that aligns seamlessly with their interests. Consumers are more likely to remember and prefer the latter when presented with a choice between a bland, generic design and a visually captivating one.
We organize all of the trending information in your field so you don't have to. Join 66,000+ users and stay up to date on the latest articles your peers are reading.
You know about us, now we want to get to know you!
Let's personalize your content
Let's get even more personalized
We recognize your account from another site in our network, please click 'Send Email' below to continue with verifying your account and setting a password.


Let's personalize your content