This site uses cookies to improve your experience. To help us insure we adhere to various privacy regulations, please select your country/region of residence. If you do not select a country, we will assume you are from the United States. Select your Cookie Settings or view our Privacy Policy and Terms of Use.
Cookie Settings
Cookies and similar technologies are used on this website for proper function of the website, for tracking performance analytics and for marketing purposes. We and some of our third-party providers may use cookie data for various purposes. Please review the cookie settings below and choose your preference.
Used for the proper function of the website
Used for monitoring website traffic and interactions
Cookie Settings
Cookies and similar technologies are used on this website for proper function of the website, for tracking performance analytics and for marketing purposes. We and some of our third-party providers may use cookie data for various purposes. Please review the cookie settings below and choose your preference.
Strictly Necessary: Used for the proper function of the website
Performance/Analytics: Used for monitoring website traffic and interactions
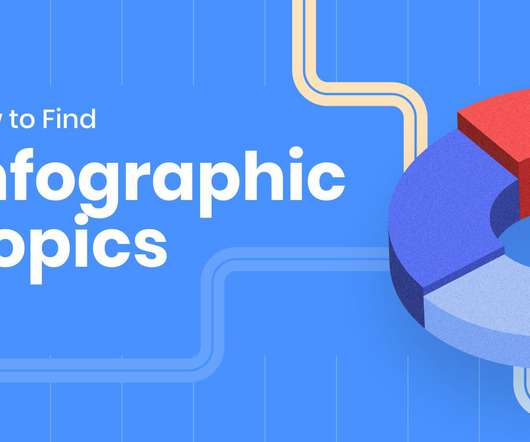
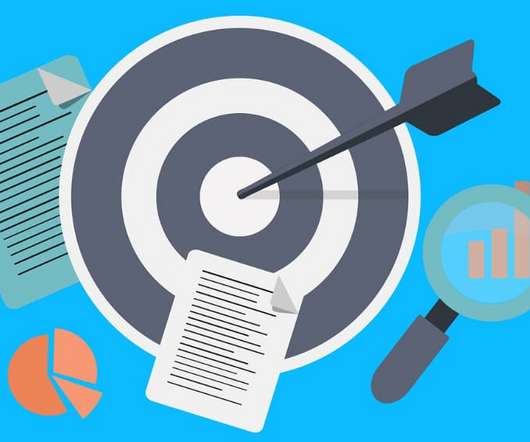
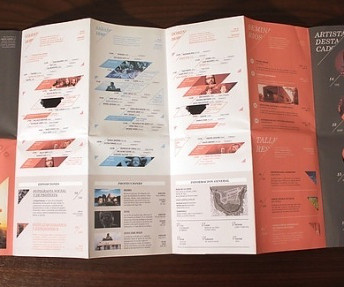
Producing infographics is one of the greatest methods to attain this aim. Infographics are one of the most common ways to graphically convey and distribute information. Infographics are also graphical representations of complicated facts. Creating infographics takes careful consideration. Come up with a great idea.
Infographics are one of the best ways to present data without making your audience yawn with boredom. There are a lot of people who have impressive data, but what they don’t know is how to create informative and well-designed infographics. Check out our list of over 40 infographic tools and create awesome infographics in no time.
Ultimate Guide to Infographics Design in Marketing Hey there! There's nothing quite like a well-designed infographic to convey information in a memorable and shareable format. However, creating effective infographics can be challenging. Infographic design is an art and a science! Let's get started!
Virtual Private Network (VPN) applications extend a private network across a public network by enabling users to send and receive data to the internet through a VPN rather than by your computer. Use Infographics. A compelling infographic can keep a visitor on your website. Optimize your image size. Use VPN apps.
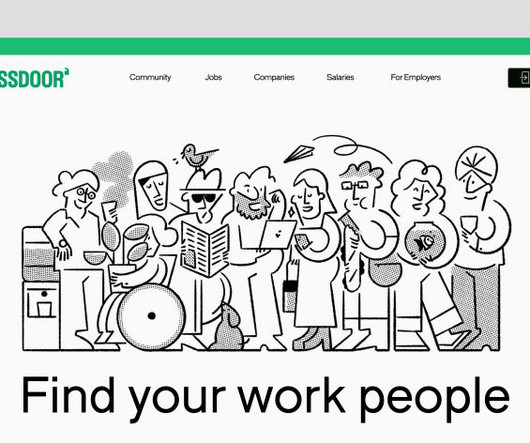
The rebrand coincides with the launch of a new mobile app and web experience, allowing users to seamlessly navigate between insights, jobs, and workplace conversations, facilitating real-time networking, advice, and connections on various work-life topics.
Infographics, for example, can convey data and statistics in an engaging and digestible format. Infographics : Visual representations of information, data, or knowledge intended to present information quickly and clearly. Facebook: Experiment with diverse formats like infographics, live videos, and carousels.
Even worse, their social networking apps used the same username and password as each individual’s webmail account. Password management apps are your friend – especially if you’re working from home on a shared network. You can find more information on how to do so in the infographic below.
Social networks became a mandatory marketing tool a long time ago, but they keep evolving and forcing marketers to figure out new ways to approach potential customers. If you are not using the right networks, you might be losing a lot of potential followers. Who is the person you’re targeting through social media networks?
As a result, you can significantly improve your marketing statistics and engage customers in a unique way using visuals such as infographics. Your endeavors will be worth it, as humans tend to remember much more things when they can see them , making infographics a powerful tool in the right hands. – Cognition.
Automatic card updaters are also a great tool for reducing involuntary churn as they check card networks to update payment information behind the scenes. For example, you can reduce card declines by using payment processors, digital wallets, and using direct debit transactions.
These Black Friday sale templates are ideal for different social media networks such as Instagram, Facebook, or Pinterest. Free Infographics Bundle. Free infographics bundle by @Alexdndz. It’s hard to believe but you can also get this full infographics bundle for free! Free Download.
If you’re a graphic designer, you’ve likely created phenomenal brand identities , logos , infographics , brochures and other striking visual deliverables, both printed and electronic. Network, Network, Network. That’s all networking is. You’ll be ahead of the competition right from the start.
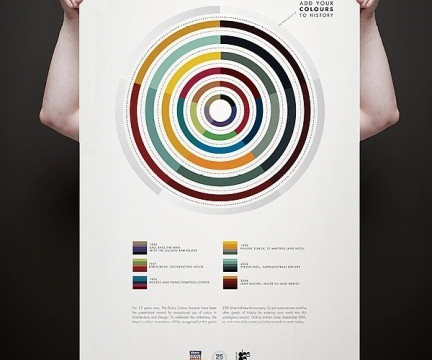
Discover more of the best Posters, Infographics, Graphic Design, Data Visualization, and Print Design inspiration on Designspiration Saved by Alex Koplin (@h34dup).
Here are their answers in an insightful infographic that sums up their recommendations. A bookworm in disguise, she is also passionate about networking, personal development, and employer branding strategies. Let us know in the comments section below! _.
It is also an ideal choice for textile design, stationery, posters, social network design, and home décor. Learn More General Use Canva Templates Blue Green and Gray Soft and Rounded Data Infographic We all know how difficult it is to process large amounts of data scattered on a screen.
Apps, social networks and operating systems are all offering dark mode options for their user-interface. About the author: Ronita Mohan is a content marketer at Venngage, the online infographic maker and design platform. This gives their brand a cohesive, minimalist feel.
Using a social networking site like Facebook will feel different than browsing a forum on Reddit. Social Networks. When you hear “social media”, the first platforms that come to mind will likely be social networks. Facebook, Twitter, and LinkedIn are super-popular platforms that function, at least in part, as social networks.
It leaves no stone unturned and gives you a clear picture of who you’re trying to engage with your content, whether that’s a blog post, video, infographic, or anything else which you’re spending valuable time on. Use More Infographics. To make information more digestible, you should create infographics alongside written posts.
Let's keep up with solutions (top 5&6): Infographics. Infographics are one way to convey the information you can use to engage the target audience. Display advertising is usually placed on websites, apps, and social networks. Publications are long-form pieces that communicate with an audience through public distribution.
Therefore, if you work on steadily building a network of backlinks for each of your critical web pages and blogs, they will rank way higher in SERP for your target keywords and drive much more organic traffic. Here’s an example of an infographic by Venngage that beautifully illustrates the topic: Image Source. Image Source.
For example, an infographic is a type of digital content quickly becoming one of the best ways to engage customers. Infographics are simple; you can share visual representations of data, information, and knowledge across various platforms, including blogs, websites, social media pages, and more. 4 – Use visuals.
AI-driven visualization tools create dynamic charts, graphs, and infographics, making data more accessible and actionable. Visit Website CHUTZPA Website Design The Network of Jewish visionaries in Germany. Real-time data feeds can be visualized in engaging and interactive ways, helping users understand complex information at a glance.
Using infographics to simplify complex information Utilising infographics is a powerful strategy for simplifying complex information and making it more digestible for your audience. So, infographics offer a visually engaging solution that enables you to convey key messages quickly and effectively!
Visual content can take many forms, from eye-catching images and short, high-impact videos to colourful infographics and interactive motion graphics. The possibilities are endless, from stunning illustrations and explainer videos to interactive infographics and engaging animations. For example, suppose you build solar panels.
Sure, you can get design on tap from the numerous freelance networks out there like Upwork, but if a shot in the dark or, really, a coin toss, is not something you’re willing to risk, that kind of glut available there is not an appealing option. And the business account is only $29/mo (billed annually). Pricing : Pablo is free to use.
Accompany your written content with photographs and infographics to capture your readers’ attention. Many likes on social networking platforms don’t make a design the best or free of mistakes. Because content is the first point of interaction with your customers, users might lose trust in your brand when your site has grammar mistakes.
Getting Graphic Design Clients Online Building an online presence and tapping into networks is critical for finding graphic design clients on the internet. InfographicsInfographics visually communicate information, data and ideas to readers more engagingly. Over 44% of millennials want more visuals and illustrations in content.
Determine the Type of Content You Will Produce: Content comes in many forms, including blog posts, videos, podcasts, infographics, and social media posts. Infographics: Infographics are visual representations of data or information, making complex concepts easier to understand and digest.
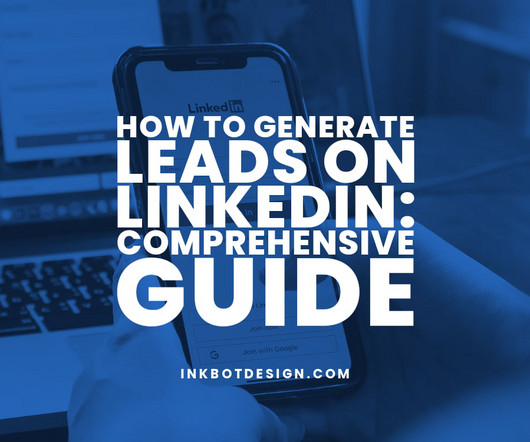
The past few years have accelerated digital transformation, making virtual networking and relationship-building now the norm. LinkedIn, focusing on career networking and lead generation features, provides fertile ground for businesses to grow their potential customer base and drive success. Why Generate Leads on LinkedIn?
You can easily make visual stories using stunning presentations and infographics with Visme. You can also embed the presentation in a website or share on social networks. After you’re done, you can share your project on social networks, or use its ‘Presentation Mode’ to present it right from your Canva account.
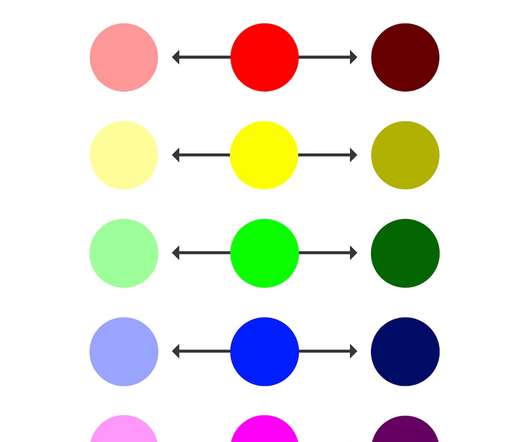
Tip 17: Infographics. From these basic questions, you should be able to get ideas about what social networks your target audience uses, what can of technology they are using, what design appeals to them plus a more concrete idea of the kind of design focus you want to go for. Tip 12: Create your designs in RGB color mode. Content tips.
The easy-to-master editor gives you access to a pool of stock photos and thousands of unique templates for social networks and your documents and even lets you download your design in JPEG, PDF, or PNG file format. Since the software works well for presentations, infographics, posters, invitations, etc.
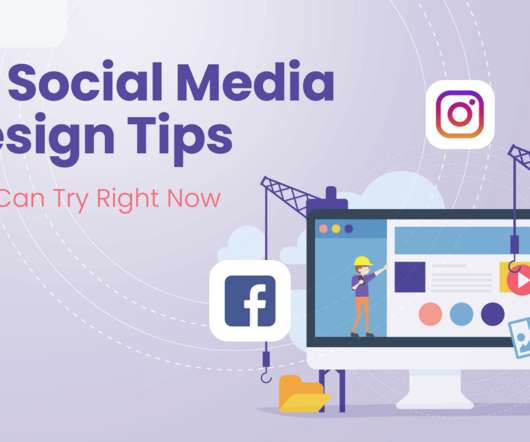
This is intuitive: as a social networking site, your goal is to keep users active, entertained, and invested in what they’re looking at. Infographics and diagrams. If you’re wondering what types of posts might have a better chance of achieving that, read on.
Design an online ad, infographic, poster and postcard. Network and standout from your competition. This is a fairly short but succinct course that covers the essentials. Produce effective designs in Photoshop, Illustrator, and InDesign. Apply color theory and typography practices. The brand design process isn’t quick or easy.
These tools are ideal for helping you review articles and include infographics. No doubt, you must have come across infographics on the internet. If you are someone who is a writer and find yourself writing content for infographics but not creating them yourself, you might want to use Infogram.
Animaker allows creating videos in various styles , namely handcraft, infographic, typography, 2D, and 2.5D. With Animaker you can insert graphs, maps, statistics, and infographic elements in videos. Also, the final video can be saved to its own cloud or shared on social networks including Facebook and YouTube. Moovly Studio.
Even the paid services of social media networks are considerably cheaper than conventional electronic media. You can do this via guest posting, creating high-quality infographics that are likely to be shared by others, and mentioning influencers on your blog. Content Marketing.
Through infographics , charts, and other visual aids, you can present data and insights, encouraging social media users to share your content, thereby expanding your reach organically. One prime example is the infographic, which can transform dry material into exciting and engaging visual content.
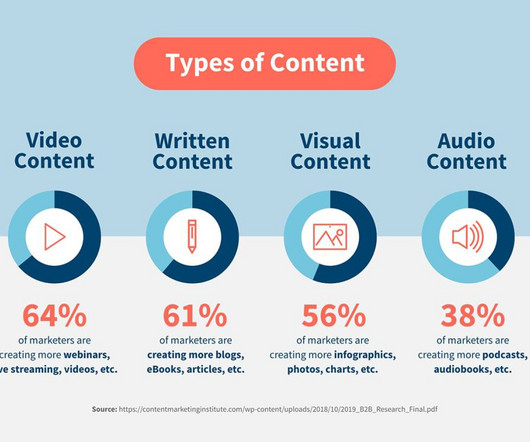
According to a study published by HubSpot, 93% of people prefer to consume visual content (videos, imagery and infographics) over text content. 3 – Infographics. Infographics are powerful visual storytelling tools. Here are some benefits of using infographics in your content marketing: They are eye-catching.
With over 900 million members , LinkedIn provides a powerful platform for businesses to network, establish thought leadership, and generate leads. One way to achieve this is by incorporating visuals such as images, videos, and infographics into your social media posts.
Discover more of the best Festival Posters, Posters, Poster Layouts, Infographics, and Flyer Design inspiration on Designspiration Saved by shambhala (@shambhala).
Grow your professional network, look to have at least 500 connections (start with dream clients and people who view your profile). Share your accomplishments and personal stories. Optimize your LinkedIn profile for keywords that your customers use to find professionals like you, i.e. “photographer Worcester, MA”. Invest in Quality Visuals.
We organize all of the trending information in your field so you don't have to. Join 66,000+ users and stay up to date on the latest articles your peers are reading.
You know about us, now we want to get to know you!
Let's personalize your content
Let's get even more personalized
We recognize your account from another site in our network, please click 'Send Email' below to continue with verifying your account and setting a password.


Let's personalize your content