This site uses cookies to improve your experience. To help us insure we adhere to various privacy regulations, please select your country/region of residence. If you do not select a country, we will assume you are from the United States. Select your Cookie Settings or view our Privacy Policy and Terms of Use.
Cookie Settings
Cookies and similar technologies are used on this website for proper function of the website, for tracking performance analytics and for marketing purposes. We and some of our third-party providers may use cookie data for various purposes. Please review the cookie settings below and choose your preference.
Used for the proper function of the website
Used for monitoring website traffic and interactions
Cookie Settings
Cookies and similar technologies are used on this website for proper function of the website, for tracking performance analytics and for marketing purposes. We and some of our third-party providers may use cookie data for various purposes. Please review the cookie settings below and choose your preference.
Strictly Necessary: Used for the proper function of the website
Performance/Analytics: Used for monitoring website traffic and interactions
My dream had always been to tell animated stories beyond infographics and architectural video presentations," he explains. "I Jose's 3D journey Based in Málaga, Spain, Jose's journey into 3D animation began unexpectedly through his work in interior design and architectural visualisation. "My
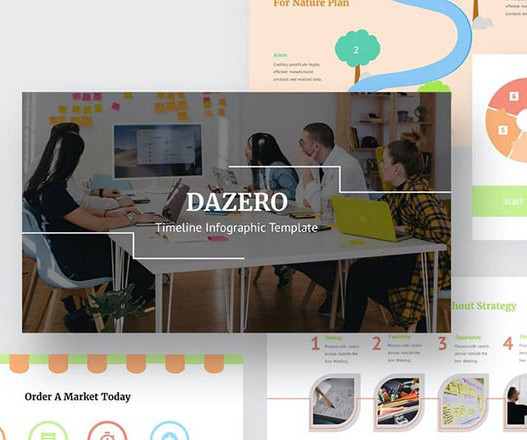
Tell a Better Story: Your Guide to This Business Presentation Template with Infographics Think about your last presentation. A truly effective business presentation template with infographics serves as the set design for your story, providing the visual structure that guides your audience through the narrative you want to tell.
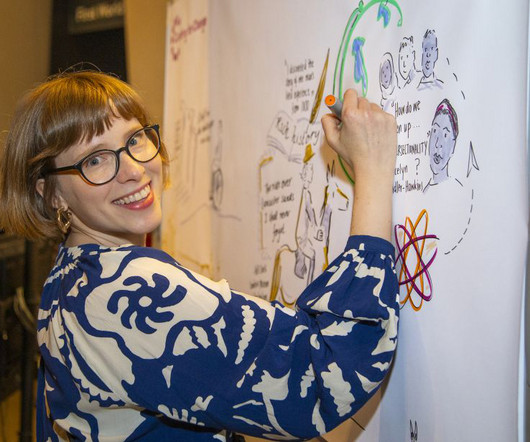
From murals to infographics to caricatures, if you can create on the fly, there could be work in it for you. Let's meet four of the world's best live event illustrators. Jacqueline Bissett A live event illustrator for nearly 20 years, Jacqueline Bissett is a pioneer who has opened the field for others to follow in her footsteps.
If you are designing a company logo, a set of custom icons for a website, or a complex infographic, Illustrator gives you the clean lines and infinite scalability you need. Developing icons and infographics for web and print. Common Uses for Illustrator: Designing logos and complete brand identity systems.
Make yourself a neat little infographic if you're feeling creativea visual representation can summarise all those notes into digestible bites! These steps are your compass, steering your rebrand towards a successful and impactful future. Before we move on to developing a rebranding strategy , summarise your findings.
Data Visual Presentation Template Transform complex data into compelling visuals with this infographic-rich PowerPoint template. Infographic PowerPoint Presentation Template A versatile infographic toolkit for creating engaging, data-driven presentations. Perfect for investors, analysts, or corporate reports.
Complete with editable charts, infographics, free fonts, and how-to-use instructions, this template offers comprehensive support for your branding needs. The template includes 24 customizable pages, resizable vector elements, editable charts, and infographics.
Poster kits, brochure layouts, and infographic templates built around clean grids, recycled-paper textures, and low-saturation tones that evoke soil, stone, and canopy. Earth Day Graphics & Templates Explore the Collection → This set is for the designers shipping campaigns under a tight deadline but still aiming for care in execution.
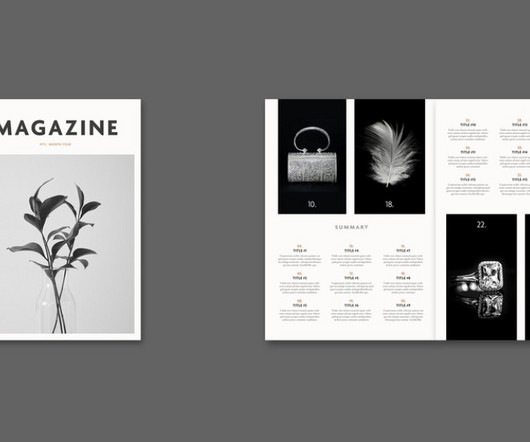
Infographics: Present data in a visually appealing way. The template provides options for creating infographics. Image Galleries: Showcase your photography with stunning image galleries. Call-to-Actions: Use strategically placed call-to-actions. Drive engagement with your audience. Who Can Benefit from This Magazine Template?
Charity Flyer Brochure InDesign Template Versatile trifold brochure template with infographic elements and statistics layouts. Features infographic elements, progress charts, and impactful statistic displays. Features gold foil effects, elegant typography combinations, and organized layer groups.
A static infographic is informative. Your customer’s feed is a firehose of information. Their brains are wired to filter out the noise and notice one thing: movement. A static logo is becoming wallpaper. A subtly animated one grabs attention. A motion graphic that visualises the data is compelling.
Despite having only placeholders, the variety in page design offers diverse visual arrangements to suit multiple content types, whether imagery, text, or infographics. This thoughtful organization enables designers, photographers, and architects to present their work in a way that’s both structured and engaging.
Flowchart Infographics PowerPoint Slides This is a versatile flowchart PowerPoint template boasting 25 unique slides with a modern widescreen layout. It contains 22 unique slides, handmade infographics, free fonts, unlimited color options, and so much more. Grab a template from our collection below and start editing.
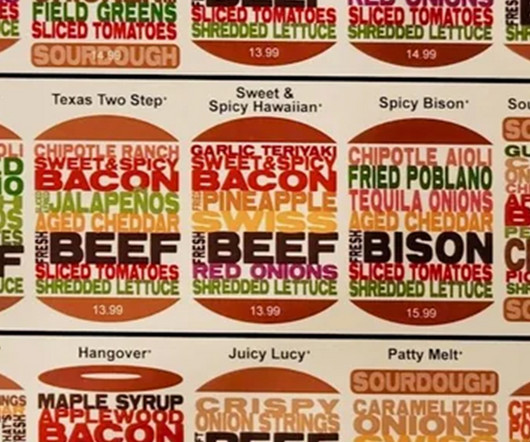
This menu design from a small local burger restaurant is giving infographic and festival lineup vibes for me, but graphic designers have serious beef with its legibility. Alas, like even the finest-quality grass-fed beef from the Argentine pampas, it can be overdone and overseasoned.
They provide you with consistent layouts for text, images, and infographics. You can download this clean portfolio presentation template by PixWork here. Thats why slide deck templates are essential. They also keep your content looking polished. A well-designed slide template can elevate any presentation. It showcases your design skills.
Uses : Websites, infographics, and presentations. Uses : Mobile apps, marketing materials, and infographics. Uses : Infographics and branding. Open Sans Open Sans is a humanist sans-serif typeface that balances neutrality and friendliness. Why Choose It : Its legibility is excellent, even in smaller sizes.
Infographics : Infographics can help convey complex information in a digestible format. Interactive Content : Quizzes, polls, and infographics enhance user interaction. Try varying your posting times, testing different content formats (like videos vs. infographics), or experimenting with other tones.
It also includes editable vector graphics, infographics, and image placeholders as well. It comes with smooth morph animations, modern typography, and neat layouts, making it perfect for presentations requiring data visualization and infographic storytelling. And it has editable charts and infographics too.
You can use it for infographics, progress tracking, or scoreboards in sports content (these sports fonts would be perfect for that). Number Text Animation Presets for Premiere Pro This pack focuses on number-based animations like countdowns, timers, and stat reveals.
It presents a unique blend of images, infographics, and text in a stylish layout, perfect for creating compelling company profiles. Perfect for showcasing your images, infographics and text in a stylish manner, it is ultra-flexible, working seamlessly with multiple versions of Adobe InDesign.
Black White PowerPoint Infographic Slides This PowerPoint template features a collection of infographic slides made in black-and-white color schemes. You’ll get lots of charts and infographics with the template too. This template is great for making all kinds of business presentations.
Infographics A common theme in design is “show, don’t tell,” Infographics are the way to do that, and you can design and include them in Word documents, from one-page brochures to multi-page booklets. Think carefully about infographics in the planning process to keep information easy to digest and understand.
Its built with SEO in mind and includes plenty of infographics to get you started. SEO Marketing Explainer Toolkit SEO (Search Engine Optimization) isnt the easiest subject to explain. Its intricate and full of ifs and buts. This video template for After Effects can help make your job easier.
This is where infographics come into play. Infographics combine text, visuals, and data in a cohesive, engaging way to present complex information simply and efficiently. The appeal of infographics lies in their ability to distill vast amounts of information into digestible pieces. Adobe Illustrator).
Canva Canva is a popular online graphic design platform that allows users to create a wide range of visual content, like social media posts, presentations, posters, infographics, and more. However, for many, logo design makers are a cost-effective and accessible solution that helps establish a visual identity.
One of the busiest sites is the Vector EPS, which contains a rather astonishing collection of vectors unique in their way with detailed descriptions like infographics, User Interface templates, etc. Also, in this site, the vectors are organized in categories to provide easy access. Vector EPS. Free Vector Maps.
Infographics : Great for breaking down complex data in a way that’s easy to share and understand. Content Formats That Benefit Most from Strong Design Not all content is created equal. Some formats naturally lend themselves to visual enhancement and perform better because of it.
Its features include a versatile master slide layout, creative photo layouts, infographics, tables, vector icons, and diagrams. Its clean and minimal design features 20 handcrafted slides, infused with masterfully created infographics and pixel-perfect illustrations. It has editable infographics, shapes, and colors too.
The template features customizable infographics, comparison slides, and timeline visuals suitable for executive presentations or academic reports. Data Table Infographic Powerpoint Template Specializing in tabular data presentation, this template transforms complex tables into visually appealing infographics. </p>
If you are not vaccinated against measles, you will most likely catch it if you are exposed. For The New York Times, Emily Baumgaertner Nunn and Marco Hernandez illustrate how measles can lead to infection in the lungs and inflammation in the brain of children , who are smaller and more susceptible.
In the early 1800s, botanist and painter Pierre-Joseph Redouté painted hundreds of lily and rose species. Nicholas Rougeux restored the illustrations by hand for an accurate and browsable catalog of flowers. Rougeux documented the tedious process. The illustrations organized by color are available as posters. (In
Don't forget to use images, infographics, or videos in your emails. Use precise language with little fluff. Bulleted lists and subheadings can break up text, making it easy to read. 7 – Incorporate Visual Elements Humans are visual creatures! These elements can significantly enhance engagement.
Pexels Several businesses know the benefits of using infographics to convey key messages through digital content marketing. A great infographic is used to improve brand awareness and credibility. Everyone is creating an infographic for their digital marketing. What is a Good Infographic?
Producing infographics is one of the greatest methods to attain this aim. Infographics are one of the most common ways to graphically convey and distribute information. Infographics are also graphical representations of complicated facts. Creating infographics takes careful consideration. Come up with a great idea.
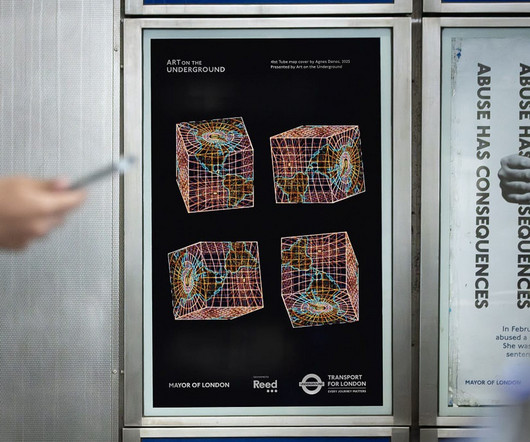
The stunning design is a prime example of what makes up some of the most inspiring infographics , balancing graphic artistry with thought-provoking, yet informative design. The humble pocket map has become a tourist staple, but often its unnoticed and unappreciated by the London local.
With Streets to Stability , Crankstart illustrates a plan to reduce homelessness in San Francisco: This report outlines 12 specific recommendations to improve the way people enter the system, the services they receive, and the overall management and support required to help them.
To help, we wanted to highlight the Top Keynote & Powerpoint Presentations & Infographics for Designers so you could look your best, even though that tie is not the right choice. 1600 Infographic Templates – $39. Infographics Templates Presentations – $29. 2000 Infographic Templates Presentations – $39.
Present your resume and cover letter professionally, with subtle visual details, and simple infographics and icon options. It includes multiple color versions, infographic features, paragraph styles, easy to use files, and is set with free fonts. Clean, Creative Resume Template. The Resume Modern Design.
All In One Experience Consumption Infographic With Animated Gif by YuJin Jung. Mountain Stone Exhibition Visual Exhibition Visual by Weiquan Long. Text of Cycle Font Design by Junheng Li. Peace and Presence Well-Being Branding by Lisa Winstanley. See more winning designs on designmag.org. Ready to submit your work?
We’ve located the best ten best graphic design courses that serve a wide variety of application areas and design styles including illustration, colour, infographics, web design and more. Introduction to Infographics with Adobe Illustrator. Introduction to Infographics with Adobe Illustrator. Digital Collage for Editorials.
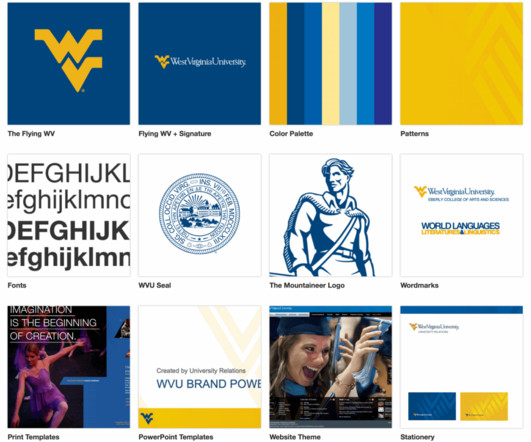
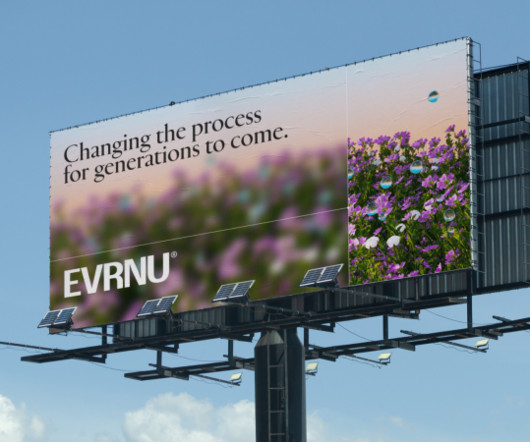
Blocks were used across the brand to create not just the logo but a moving language, from illustrative patterns to infographics. This principle was carried through to the identity by building the entire system out of moving parts.
Meanwhile, animated infographics are on hand to demystify Evrnu and NuCycl's process, and parallax scrolling effects ensure user engagement as they navigate the site. Large spaces dedicated to typography strongly emphasise Evrnu's mission-based philosophy, while the use of a subtle yet precise grid evokes the science underpinning the brand.
The PowerPoint templates are simple, contemporary but powerful design that includes creative photo layouts, infographics, tables, vector icons, maps, diagrams and tons of great features to show your work and your company profile on another level. Agile Infographics Powerpoint. Minimal Presentation Bundle. Roadmap PowerPoint Template.
Infographics, for example, can convey data and statistics in an engaging and digestible format. Infographics : Visual representations of information, data, or knowledge intended to present information quickly and clearly. Facebook: Experiment with diverse formats like infographics, live videos, and carousels.
We organize all of the trending information in your field so you don't have to. Join 66,000+ users and stay up to date on the latest articles your peers are reading.
You know about us, now we want to get to know you!
Let's personalize your content
Let's get even more personalized
We recognize your account from another site in our network, please click 'Send Email' below to continue with verifying your account and setting a password.


Let's personalize your content