Remove tag data-science
article thumbnail

Educational statistics illustrations

FlowingData

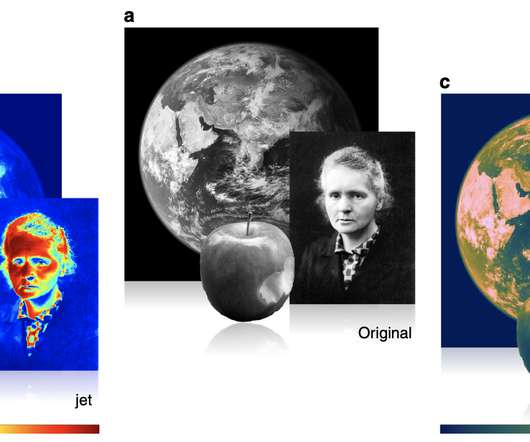
Allison Horst often illustrates data science concepts and tools with anthropomorphized shapes and animals. Tags: Allison Horst , humor , illustration , teaching. She recently cataloged her illustrations , which are open source and entertaining if you are a nerd.

Education 107
article thumbnail

Bias in AI is a mirror of our culture

UX Collective

The data used to train these models comes from a fundamentally biased society; it is impossible to eliminate them entirely. There are many other examples from our past: Google’s image tagging algorithm from 2015 labeled a pair of black friends “gorillas.” The AI is just reflecting them back to us. The past is a very racist place.

Insiders

Sign Up for our Newsletter

This site is protected by reCAPTCHA and the Google Privacy Policy and Terms of Service apply.

article thumbnail

How AI is Changing User Experience

Inkbot Design

With massive behavioural data and complex algorithms, AI can build detailed user profiles and predict preferences. Algorithms track browsing data, purchase history, reviews and ratings to suggest products you likely want to buy. Systems can now understand human inputs like speech, images, video and sensor data.

Coding 89
article thumbnail

Analysis of text messages with an ex-boyfriend

FlowingData

It’s also easy to intentionally or unintentionally manipulate data to favor a narrative. I haven’t taken a statistics or data science course in forever, but I still think every student should have to collect and analyze data about themselves. Tags: relationships , Teresa Ibarra , texting

63
article thumbnail

15 Web Development Technologies Every Developer Must Know

Inkbot Design

Uses “tags” wrapped in angle brackets like <h1> to indicate headings, paragraphs, lists, etc. Can call APIs and display dynamic JSON data JavaScript took websites from static to dynamic – it's that important! Server hardware and software deliver files and data in response to inbound requests.

article thumbnail

Introduction to Data Science, an open source book

FlowingData

Introduction to Data Science , by Harvard biostatistics professor Rafael A. Irizarry, is an open source book that provides, as you might have guessed, an introduction to data science: The demand for skilled data science practitioners in industry, academia, and government is rapidly growing.

132
132
article thumbnail

Misuse of the rainbow color scheme to visualize scientific data

FlowingData

Fabio Crameri, Grace Shephard, and Philip Heron in Nature discuss the drawbacks of using the rainbow color scheme to visualize data and more readable alternatives: The accurate representation of data is essential in science communication. Tags: color , nature , rainbow , science