This site uses cookies to improve your experience. To help us insure we adhere to various privacy regulations, please select your country/region of residence. If you do not select a country, we will assume you are from the United States. Select your Cookie Settings or view our Privacy Policy and Terms of Use.
Cookie Settings
Cookies and similar technologies are used on this website for proper function of the website, for tracking performance analytics and for marketing purposes. We and some of our third-party providers may use cookie data for various purposes. Please review the cookie settings below and choose your preference.
Used for the proper function of the website
Used for monitoring website traffic and interactions
Cookie Settings
Cookies and similar technologies are used on this website for proper function of the website, for tracking performance analytics and for marketing purposes. We and some of our third-party providers may use cookie data for various purposes. Please review the cookie settings below and choose your preference.
Strictly Necessary: Used for the proper function of the website
Performance/Analytics: Used for monitoring website traffic and interactions
If you are designing a company logo, a set of custom icons for a website, or a complex infographic, Illustrator gives you the clean lines and infinite scalability you need. Developing icons and infographics for web and print. Create stunning graphics for social media, blogs, or websites.
Infographics: Present data in a visually appealing way. The template provides options for creating infographics. Bloggers: Transform your blog into a visually stunning magazine. Image Galleries: Showcase your photography with stunning image galleries. Call-to-Actions: Use strategically placed call-to-actions.
Here’s how it’s practically being used right now in the graphic design industry: Radical Automation: All the grunt work—creating 50 different banner ad sizes, generating stock-like imagery for a blog post, mocking up a concept in a dozen settings—can be done in a fraction of the time. A static infographic is informative.
Uses : Websites, infographics, and presentations. Uses : Mobile apps, marketing materials, and infographics. Uses : Infographics and branding. Uses : Events, educational materials, and casual blogs. A Real-World Example of Font Pairing Let me give you an example from my recent blog launch. The result?
I recently made a quick design tutorial video and uploaded it alongside a blog post. Infographics : Infographics can help convey complex information in a digestible format. Interactive Content : Quizzes, polls, and infographics enhance user interaction. The feedback? Phenomenal!
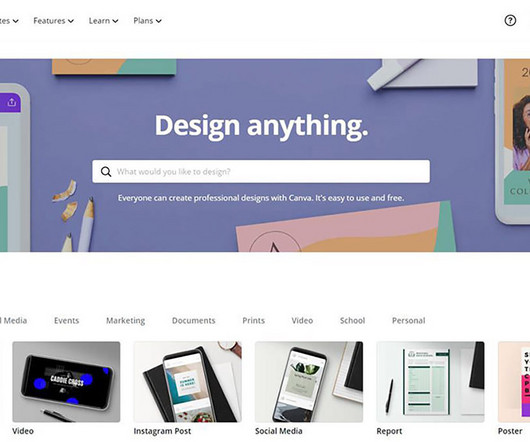
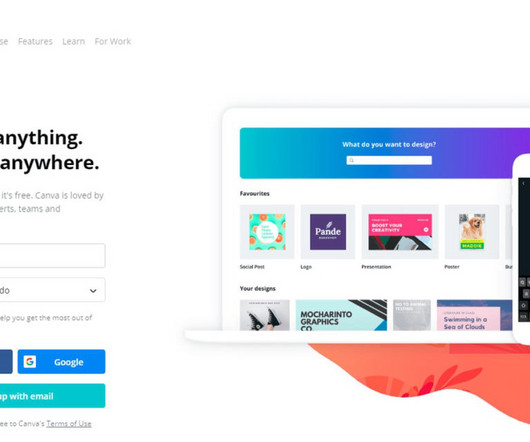
Canva Canva is a popular online graphic design platform that allows users to create a wide range of visual content, like social media posts, presentations, posters, infographics, and more. However, for many, logo design makers are a cost-effective and accessible solution that helps establish a visual identity.
In the early days of digital marketing, B2B content often meant long whitepapers, text-heavy PDFs, and dry blog posts. Infographics : Great for breaking down complex data in a way that’s easy to share and understand. Fast forward to 2025, and were looking at an audience that demands more, not just in value, but in experience.
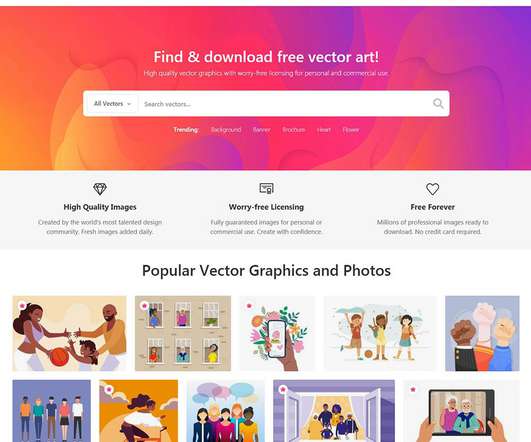
One of the busiest sites is the Vector EPS, which contains a rather astonishing collection of vectors unique in their way with detailed descriptions like infographics, User Interface templates, etc. Also, in this site, the vectors are organized in categories to provide easy access. Vector EPS. Free Vector Maps.
Don't forget to use images, infographics, or videos in your emails. Instead of sending a generic response, I took the time to craft a detailed answer, linking to specific blog articles. Use precise language with little fluff. Bulleted lists and subheadings can break up text, making it easy to read.
Pexels Several businesses know the benefits of using infographics to convey key messages through digital content marketing. A great infographic is used to improve brand awareness and credibility. Everyone is creating an infographic for their digital marketing. What is a Good Infographic?
Producing infographics is one of the greatest methods to attain this aim. Infographics are one of the most common ways to graphically convey and distribute information. Infographics are also graphical representations of complicated facts. Creating infographics takes careful consideration. Come up with a great idea.
When most people think of the factors that make an excellent blog, great writing is the first thing that comes to mind. But whether you realize it or not, images are also a key determinant of the success of your blog. Why exactly are images so important for your blog? The Best Types of Images for Your Blog. Infographics.
That’s where a blog can help you. But setting up and writing a blog is only one part of the equation. To succeed in business, you need a blog that turns leads into paying customers and offers something unique to potential clients. Let’s look at that 3-step blogging strategy in this article. It’s blogging with a purpose.
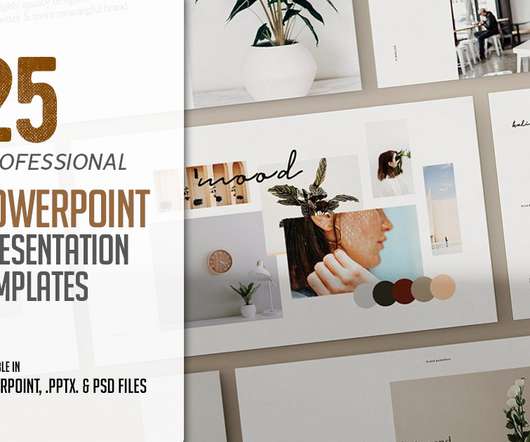
The PowerPoint templates are simple, contemporary but powerful design that includes creative photo layouts, infographics, tables, vector icons, maps, diagrams and tons of great features to show your work and your company profile on another level. Essential Blog Design Tips For Beginners. Agile Infographics Powerpoint.
What are the best things to write about on my blog? If you’ve ever been tasked with writing blog posts, then you probably know that coming up with the idea after idea can be difficult. You want to keep the blog fresh. It isn’t uncommon for many blog writers to eventually run out of post ideas.
All In One Experience Consumption Infographic With Animated Gif by YuJin Jung. Mountain Stone Exhibition Visual Exhibition Visual by Weiquan Long. Text of Cycle Font Design by Junheng Li. Peace and Presence Well-Being Branding by Lisa Winstanley. See more winning designs on designmag.org. Ready to submit your work?
Use interactive features like animations, an infinite scroll layout, and hover-over infographic pop-ups—these keep customers on your website longer. The post <strong>4 Ways to Use Design to Spice Up Your Small Business</strong> appeared first on Designer Daily: graphic and web design blog.
Ultimate Guide to Infographics Design in Marketing Hey there! There's nothing quite like a well-designed infographic to convey information in a memorable and shareable format. However, creating effective infographics can be challenging. Infographic design is an art and a science! Let's get started!
Infographics, for example, can convey data and statistics in an engaging and digestible format. Infographics : Visual representations of information, data, or knowledge intended to present information quickly and clearly. Facebook: Experiment with diverse formats like infographics, live videos, and carousels.
How to Start a Design Blog to Grow Your Business Well, well, well, if it isn't my fellow design ninjas! Listen up, my friends, because I've got some important news for you – if you're not blogging , you're missing out on a chance to level up your business. Now, some of you might be thinking, “Blogging? Who are they?
Infographics have just lately entered our lives as a tool for improving user experience in website design. Infographics are incredibly popular methods for delivering facts in a more interesting and engaging style. You must have the facts presented in a logical, easy-to-understand format so that you can effectively apply your learnings.
Adobe Illustrator Discover the ultimate vector graphics tool with Adobe Illustrator – the industry standard for professional logos, artwork, infographics, and icons. The post 8 Awesome Graphic Design Tools for 2023 appeared first on Designer Daily: graphic and web design blog.
Sure you can use paid advertising to promote it, but there’s nothing stopping you from creating your own blog and getting content up and running. In this blog post we’ve rounded up the ultimate list of content marketing tips and ideas so that by the end of it, you’re a content marketing pro! Maybe you want to improve your SEO efforts?
These are great for tables , charts, and infographics. The post Font Trends That Any Designer Should Know appeared first on Designer Daily: graphic and web design blog. It’s about choosing typefaces that everyone can read easily, including people with visual impairments or reading difficulties.
Modern and powerful templates design that includes creative photo layouts , infographics, tables, vector icons, maps, diagrams and tons of great features to show your work and your company profile on another level. Perfect for digital brand guidelines, marketing pack or blog kit, the template can be customised for any business or industry.
Finding Examples: Fashion Magazines: Look for recent issues of fashion magazines or fashion blogs to see if they’re featuring asymmetrical clothing trends. Design Blogs and Websites: Explore design blogs and websites dedicated to interior design or graphic design to see if asymmetry is a current theme.
It is amazingly fitting for your use, including powerful slides, charming infographics, amazing photo layouts, cool colors, maps, Smart Art diagrams, and other features. . Searching for a contemporary design, the Space template is the ideal way to express yourself, your creativity, and your aesthetics.
Web content can range from blog posts and product descriptions to photos and landing pages. Accompany your written content with photographs and infographics to capture your readers’ attention. You could suggest similar blog posts or videos that users might enjoy before they leave your website. Content Quality Mistakes.
For this blog post, we’re jotting down the best Keynote templates for designers, agencies & creatives today! Image credits: Design cuts Brush slides, comprehensive infographic sets, service slides, team slides, portfolio slides—what more can you ask for? We’ve got you covered if you have a big presentation coming up!
According to HubSpot , businesses that publish 16 or more blog posts per month get 3.5 times more traffic than those that publish four or fewer blog posts per month. Determine the Type of Content You Will Produce: Content comes in many forms, including blog posts, videos, podcasts, infographics, and social media posts.
With its help, they have no trouble creating email headers, infographics for their blog posts, presentations, etc. This software is a must-have for those dealing with information graphics. More than ten million people are using this service throughout the world.
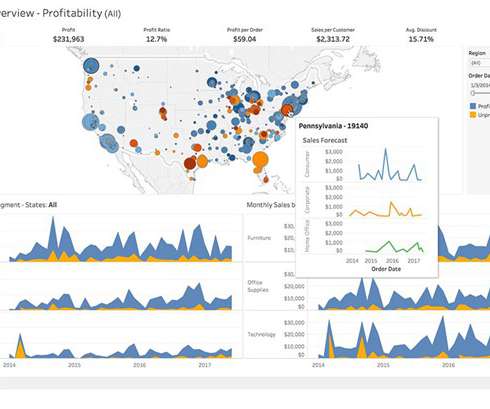
They have a comprehensive exhibition of infographics and representations that have been made with the public form to fill in as motivation for the individuals who are keen on making their own. To put it shortly, Tableau is a beast.
Pinterest is one of the most underrated social media platforms, which – if done right – can help you drive engagement and traffic to your blog, product, or website. Visme — Aweb-based platform that allows users to create and share visually appealing presentations, infographics, reports, and other visual content.
Pin the image below to save the blog for later. Infographic: What your Logo’s Font Says About Your Brand. Thanks to Brand Marketing Blog for the below infographic. Light on the eyes and a breeze to look at, Albori is a terrific choice for materials that call for lengthy paragraphs and text-heavy visuals.
There are so many types of landing pages and, in this blog post, we are going to dive into 5 great examples to give you inspiration for designing your own. These designs could include illustrations of your product’s features, or even infographics that outline its benefits. Read on to find out more.
This content ranges from reviews, testimonials, and social media posts to photos, videos, and blog articles. This could include images, videos, or infographics. Post regularly on social media, publish new content on your blog, and run paid advertising campaigns on a regular basis. Be consistent.
Take a look at Adjust’s blog and how they’re using flat icons to create a cohesive brand feel. About the author: Ronita Mohan is a content marketer at Venngage, the online infographic maker and design platform. Flat icons and illustrations were all the rage a few years ago before 3D aesthetics took the world by storm.
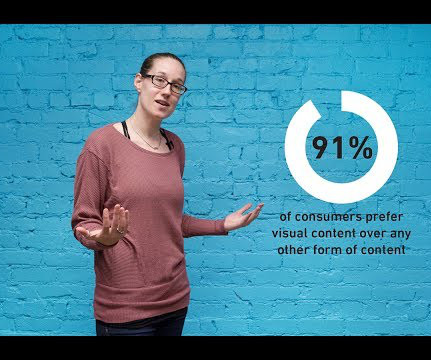
Let’s see some numbers: Content enriched with infographics gets 94% more views than articles without images. InfographicsInfographics represent a combination of images plus texts representing complex data or concepts distilled into easily readable graphics. Tweets (X Posts?) featuring images are twice as likely to be retweeted.
It excels as a tool for creating blog graphics, posters, Instagram posts, Facebook cover photos, banners, resumes, business cards, and more. Since the software works well for presentations, infographics, posters, invitations, etc. Easiest InDesign alternative to operate Platform : Windows/Android/iOS/Mac Price Free Pro – $119.99/year
Images, videos, infographics, and other graphic formats allow marketers to tell stories, convey complex information, and evoke emotions in ways that text alone often cannot. Articles and blogs with relevant images get 94% more views than those without, according to content marketing platform Buzzsumo. High-quality photos perform best.
InfographicsInfographics visually communicate information, data and ideas to readers more engagingly. The demand for custom infographics keeps rising across websites, presentations, reports and social media. Clients continually want sites built and updated for personal branding , blogging, ecommerce and lead generation.
Choose Content Themes and Types Decide within your defined content pillars or themes what mix of content types and formats you'll use to achieve your goals: Written: Blog posts, ebooks, guides, case studies etc. Visual: Videos, graphics/presentations from SlideShare/infographics/handouts/templates/checklists etc.
Let's say you're designing an infographic on designing for brands. Whether a design for a gaming website , lifestyle blog, Instagram post, or infographic , you can play with two elements to create a visual hierarchy: size (the dimension) and scale (size relative to other elements). Modify visibility with size.
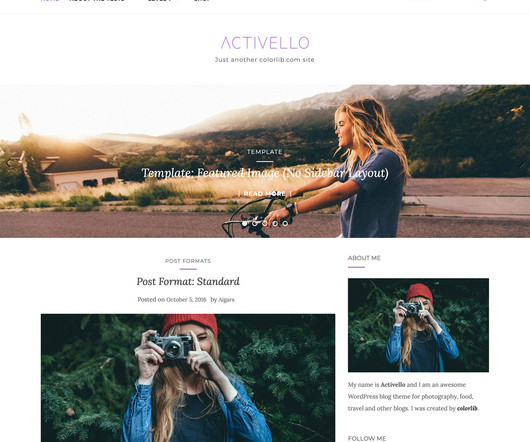
That’s precisely why this compilation highlights 40 sleek and minimalistic WordPress Themes suitable for a range of purposes including blogging, portfolios, photography sites, magazines, corporate sites , and more, catering to diverse preferences. Preview theme Blog Way Designed for bloggers, Blog Way offers a simple and clean aesthetic.
We organize all of the trending information in your field so you don't have to. Join 66,000+ users and stay up to date on the latest articles your peers are reading.
You know about us, now we want to get to know you!
Let's personalize your content
Let's get even more personalized
We recognize your account from another site in our network, please click 'Send Email' below to continue with verifying your account and setting a password.


Let's personalize your content