This site uses cookies to improve your experience. To help us insure we adhere to various privacy regulations, please select your country/region of residence. If you do not select a country, we will assume you are from the United States. Select your Cookie Settings or view our Privacy Policy and Terms of Use.
Cookie Settings
Cookies and similar technologies are used on this website for proper function of the website, for tracking performance analytics and for marketing purposes. We and some of our third-party providers may use cookie data for various purposes. Please review the cookie settings below and choose your preference.
Used for the proper function of the website
Used for monitoring website traffic and interactions
Cookie Settings
Cookies and similar technologies are used on this website for proper function of the website, for tracking performance analytics and for marketing purposes. We and some of our third-party providers may use cookie data for various purposes. Please review the cookie settings below and choose your preference.
Strictly Necessary: Used for the proper function of the website
Performance/Analytics: Used for monitoring website traffic and interactions
In the internet-dominated commercial climate that we live in, images and visual marketing have been used as effectives tools for sales by digital marketers and eCommerce businesses alike. Infographics are more than mere pie charts, histograms, or bar graphs. ColorTheory. This is an example of colortheory at work.
Infographic design: what is it, and how do we create awesome infographics? Let's take look at some of the ins and outs of what infographics are, data visualizations, and what makes an infographic really work well. So let's dig in and talk about infographics. So let's dig in and talk about infographics.
Canva Templates Canva Templates offers a vast collection of customizable templates for social media, marketing, and branding, with a user-friendly drag-and-drop interface. Creative Market Creative Market offers a vast collection of design assets, including fonts, graphics, templates, and themes, from independent creators.
Another class taught by Ellen Lupton, along with Jennifer Cole Phillips will show you how those basic principles can be perfect to use in all projects that range from creative design, marketing, to even photography. Apply colortheory and typography practices. Design an online ad, infographic, poster and postcard.
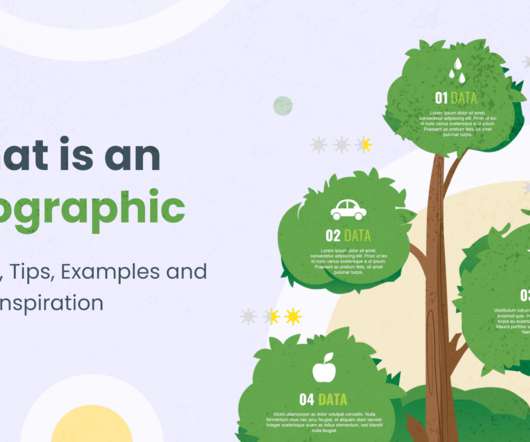
In today’s article, we’ll review all you need to know about what is an infographic. We’ll look into the anatomy of infographics, their elements, what makes an infographic great. Of course, we’ll also include many examples and useful tips that will inspire you to create your own engaging infographics.
Data Visualization VS Infographics: 5 Main Differences. Common cases when data visualization sees use are in sales and marketing, healthcare, science, finances, politics, and logistics. Renting & Salary Statistics Infographic by Natalie Zuieva. Getting market insights about audience behavior. How Does it Work?
There are different types of data visualizations such as: Infographics Charts Diagrams Maps. Regardless of whether you’re using them as standalone visuals or in conjunction with infographics or charts, make sure the icons you incorporate are in line with the overarching theme of the report. Source: Venngage.
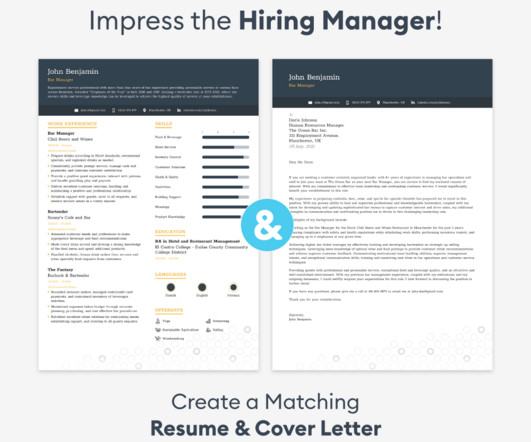
You're not just listing past jobs—you're marketing yourself as a creative pro. Infographic Resume Use data visualisation like charts, graphs, timelines, and icons to convey your background and skills—Emphasise quantifiable achievements concisely. The infographic style doesn't fit some corporate cultures.
Get suggestions for elements to include in a marketing campaign. What are the key elements to include in a Landing Page for a marketing campaign? Incorporating features into your website. What are some creative ways to incorporate Video Content into web design? Get explanations on design concepts.
It’s very interactive, full of infographics, and it has plenty of high-quality images and illustrations. Interactive infographics. Blueventure – Utilizing ColorTheory. Birkenstock – New Market, New Version. A great example for: Separate edition for each target market. High-quality images.
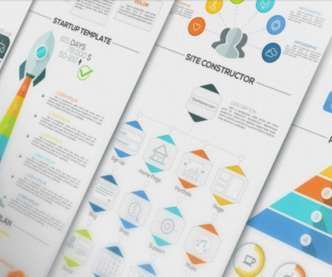
The ONE by TemplateMonster has already boosted the digital market and is ready to provide tons of brilliant products. Designers and illustrators will appreciate the service since the subscription includes the "Graphics" section, where you can find PSD sources, logo templates, illustrations, and even infographic elements.
Use the right alignment for your infographic and let the details read better, just like the Pink and Brown Modern Beauty Skincare Infographic template. Color is a powerful tool for designers, so it makes sense that a carefully arranged and consistent palette would be an important step in all design endeavors. Use this template.
Vibrant Visuals: Putting Colour Into Practice Having discussed colour theory and strategy, here are examples of excellent web design colour palettes that bring these principles to life in the real world. What are some tips for using colours in data visualisation or infographics?
This next selection of tutorials features great designs for marketing, stationery, and promotional work. Learn the benefits of using actions to create amazing infographics. Learn how to use custom shapes to create colorful flowers and fruit. Learn more about colortheory and proportion with this thorough lesson.
We organize all of the trending information in your field so you don't have to. Join 66,000+ users and stay up to date on the latest articles your peers are reading.
You know about us, now we want to get to know you!
Let's personalize your content
Let's get even more personalized
We recognize your account from another site in our network, please click 'Send Email' below to continue with verifying your account and setting a password.


Let's personalize your content