This site uses cookies to improve your experience. To help us insure we adhere to various privacy regulations, please select your country/region of residence. If you do not select a country, we will assume you are from the United States. Select your Cookie Settings or view our Privacy Policy and Terms of Use.
Cookie Settings
Cookies and similar technologies are used on this website for proper function of the website, for tracking performance analytics and for marketing purposes. We and some of our third-party providers may use cookie data for various purposes. Please review the cookie settings below and choose your preference.
Used for the proper function of the website
Used for monitoring website traffic and interactions
Cookie Settings
Cookies and similar technologies are used on this website for proper function of the website, for tracking performance analytics and for marketing purposes. We and some of our third-party providers may use cookie data for various purposes. Please review the cookie settings below and choose your preference.
Strictly Necessary: Used for the proper function of the website
Performance/Analytics: Used for monitoring website traffic and interactions
Put together a portfolio and blog. Another class taught by Ellen Lupton, along with Jennifer Cole Phillips will show you how those basic principles can be perfect to use in all projects that range from creative design, marketing, to even photography. Apply colortheory and typography practices. Lynda / LinkedIn Learning.
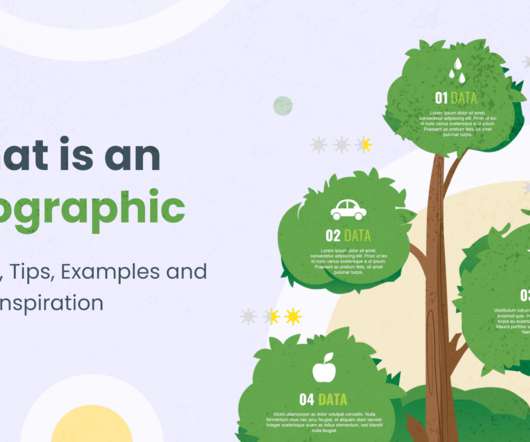
In today’s article, we’ll review all you need to know about what is an infographic. We’ll look into the anatomy of infographics, their elements, what makes an infographic great. Of course, we’ll also include many examples and useful tips that will inspire you to create your own engaging infographics.
Data Visualization VS Infographics: 5 Main Differences. Common cases when data visualization sees use are in sales and marketing, healthcare, science, finances, politics, and logistics. Renting & Salary Statistics Infographic by Natalie Zuieva. Getting market insights about audience behavior. How Does it Work?
It’s very interactive, full of infographics, and it has plenty of high-quality images and illustrations. Interactive infographics. Blueventure – Utilizing ColorTheory. From creative headlines to a great podcast section and a variety of other videos and blog posts. An amazing blog section.
Home Page , Contact Page , Services , FAQ , Testimonials , Blog , Portfolio , Pricing Page , Careers , Case Studies Page , Gallery Page , Reviews Page , News Page , Jobs Page , Products Page Show more Show less 8. Get suggestions for elements to include in a marketing campaign. Incorporating features into your website.
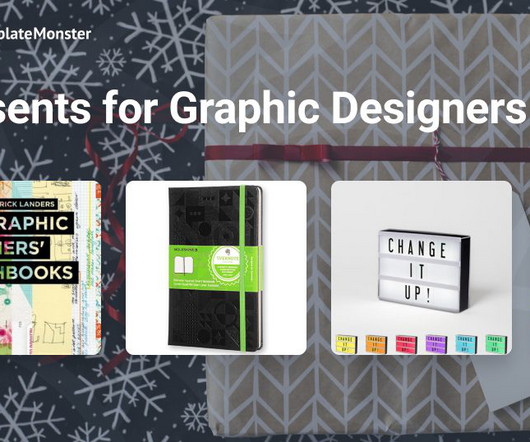
That’s why this blog post is a compilation of my ideas for awesome Christmas presents for graphic designers. The ONE by TemplateMonster has already boosted the digital market and is ready to provide tons of brilliant products. Mounted on beautiful decorator-weight neutral-colored fabric, the pillow measures approximately 16 x 16.
We organize all of the trending information in your field so you don't have to. Join 66,000+ users and stay up to date on the latest articles your peers are reading.
You know about us, now we want to get to know you!
Let's personalize your content
Let's get even more personalized
We recognize your account from another site in our network, please click 'Send Email' below to continue with verifying your account and setting a password.


Let's personalize your content