The map is one of the earliest and most important human inventions. It helps us to navigate our complex world. Maps simplify complex spaces, create shared understanding, reveal hidden insights and help us coordinate action. Around 25,000 B.C. a person carved the earliest known map into a mammoth tusk. It depicted the land routes around what is now Pavlov in the Czech Republic. Since then, humans have used maps in almost every area of life including global exploration, space travel, circuit design, vehicle navigation, project planning and locating pirate treasure (allegedly). It is not a surprise, then, that as UX designers have been tasked with more complex challenges, we have increasingly turned to the ancient power of maps.
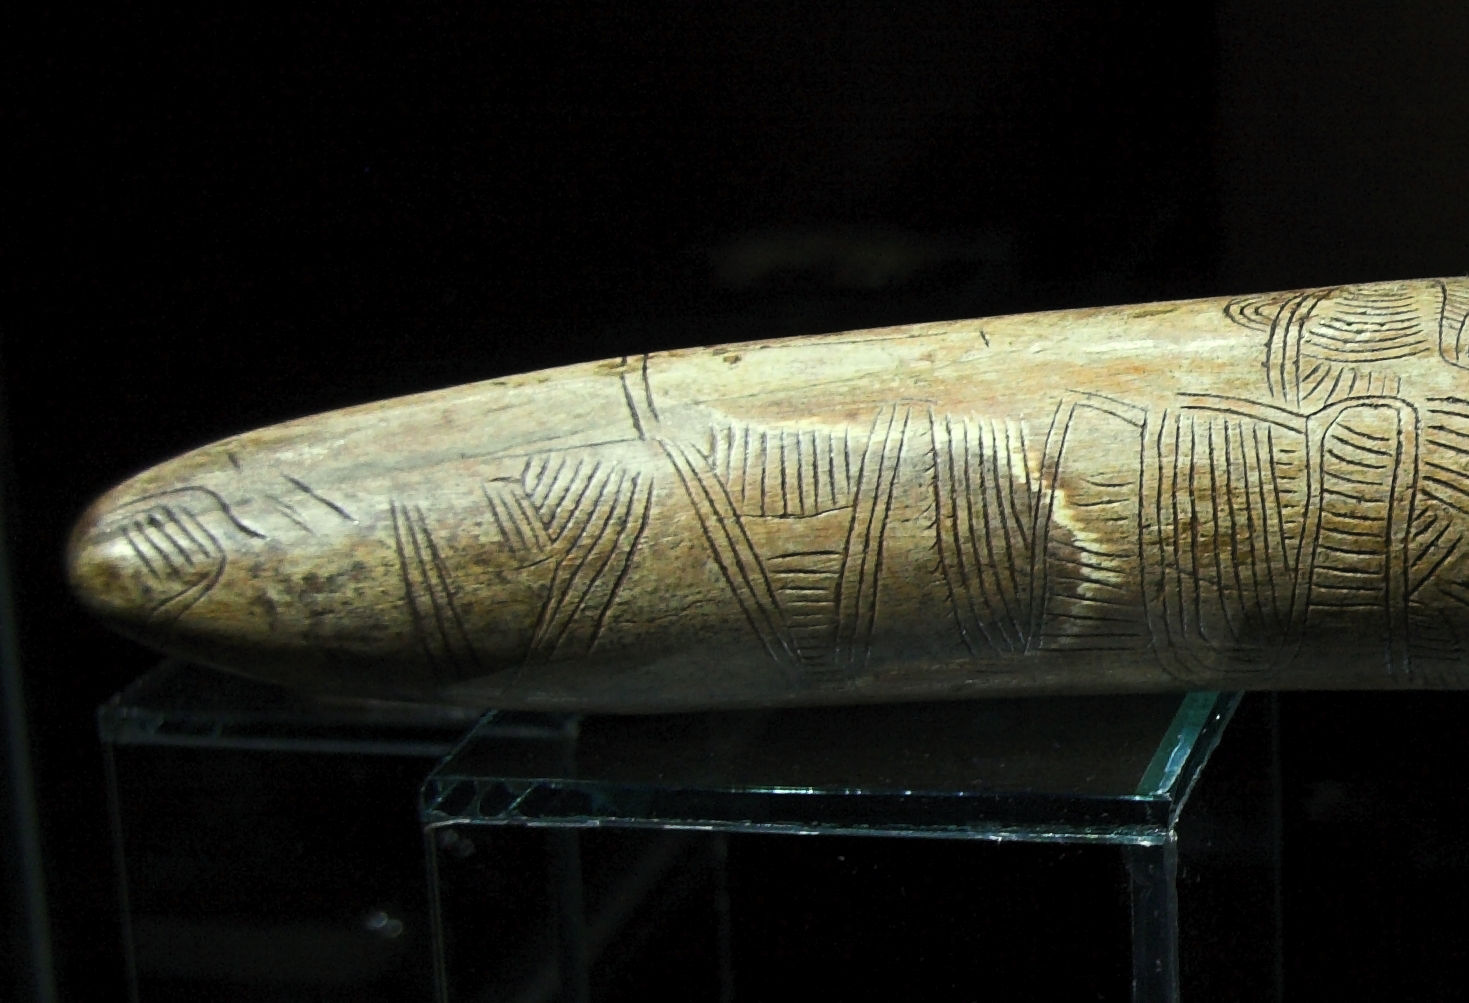
© zk, Creative Commons Attribution-Share Alike 4.0 International
Why are we talking about an invention that is tens of thousands of years old when our goal is to design better cutting-edge technology? It’s because in order to understand why journey mapping works so well and how you can adapt it for your own projects, it helps to first understand the reasons that maps have worked so well for humans for so long. As you will see, the creator of the mammoth tusk map leveraged many of the same powerful dynamics that you will be tapping into when you create a journey map.
Maps Simplify Complex Spaces
Imagine it is a cold December day and a friend texts you from the south part of New York City. It is her first trip to New York. She is in a rush to reach the north part of the city. She only has enough cash to take the subway, and she needs your help. You do a quick search online and find the following three maps. Which one would you send to her?
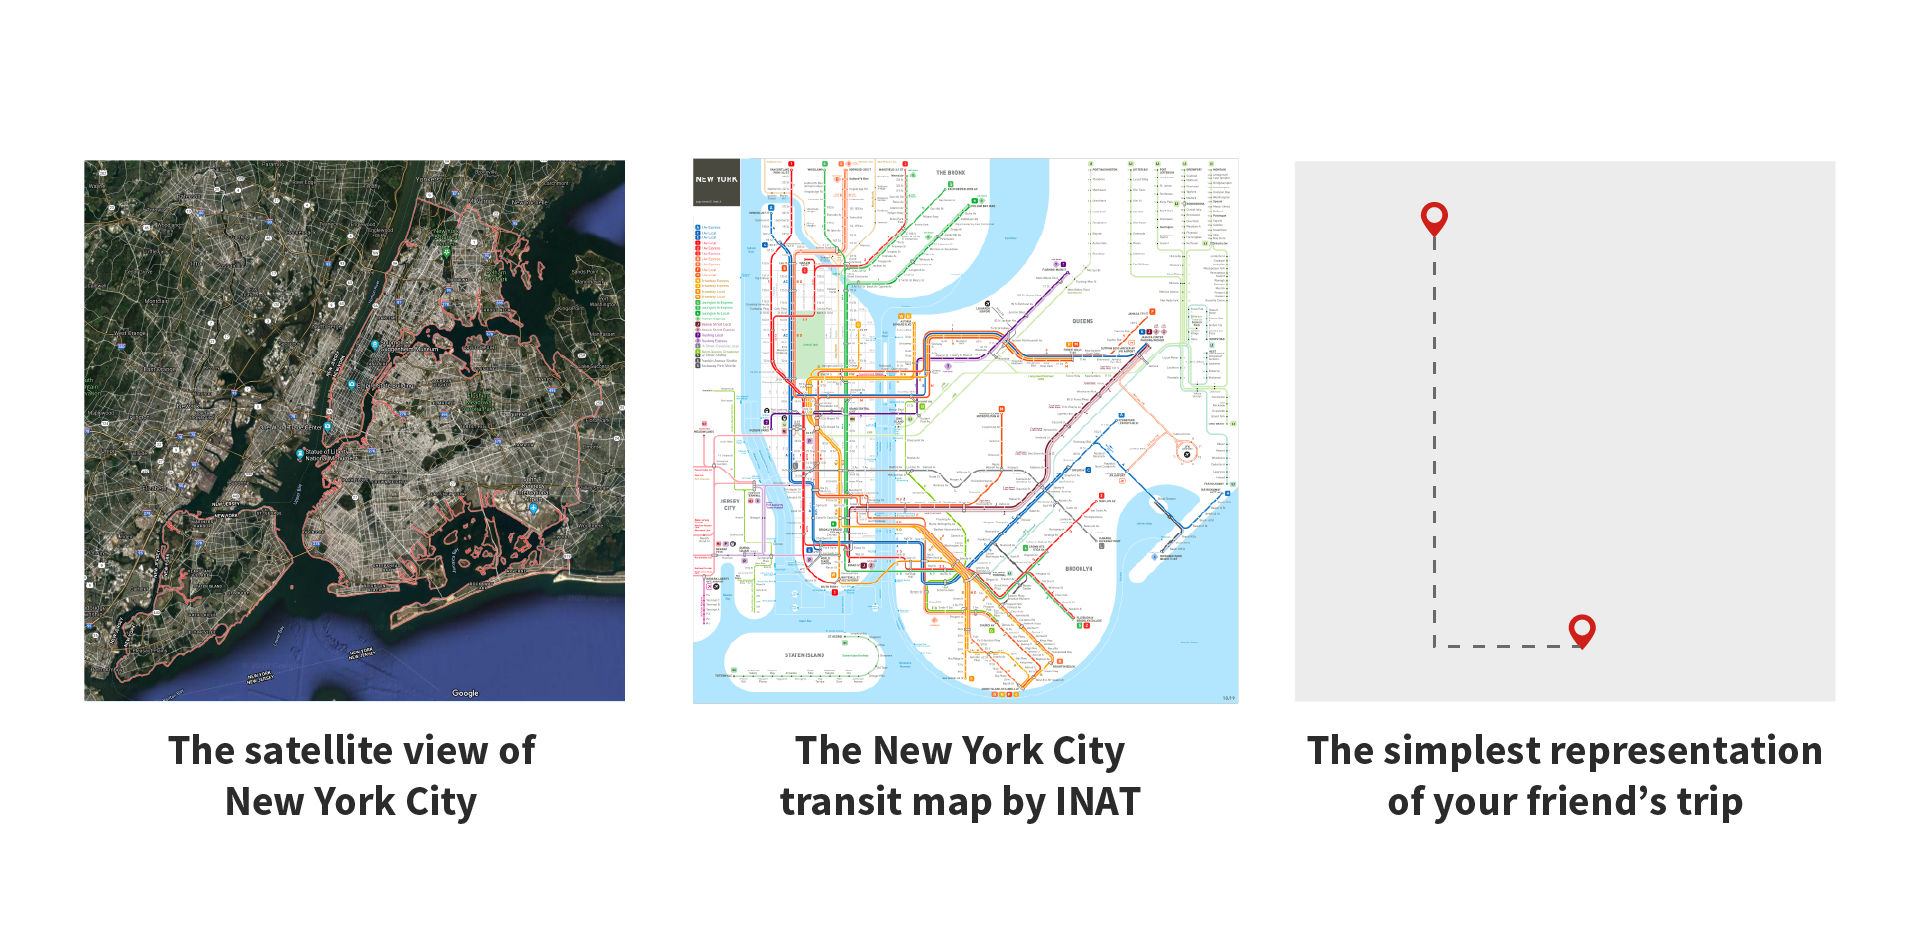
© Google Maps, Fair Use, © INAT, Fair Use, © Christian Briggs and Interaction Design Foundation, CC BY-SA 3.0.
Unless you are a very bad friend, you would of course send her the second map. The first has way too much detail, and the third map doesn’t have nearly enough. This exaggerated example shows us something important about maps. Maps simplify complex spaces. Perhaps more importantly, useful maps simplify complex spaces just enough.
A useful map shows what you need to know and leaves out what you don’t. To reach her destination, your friend doesn’t need to know the location of Interstate 95, the location of the Empire State Building or the location of the New York/New Jersey border. She does need to know which subway lines will take her there, and where she will need to switch lines.
As you begin to create your own journey maps, you will develop the ability to find the right level of simplicity.
Maps Create Shared Understanding
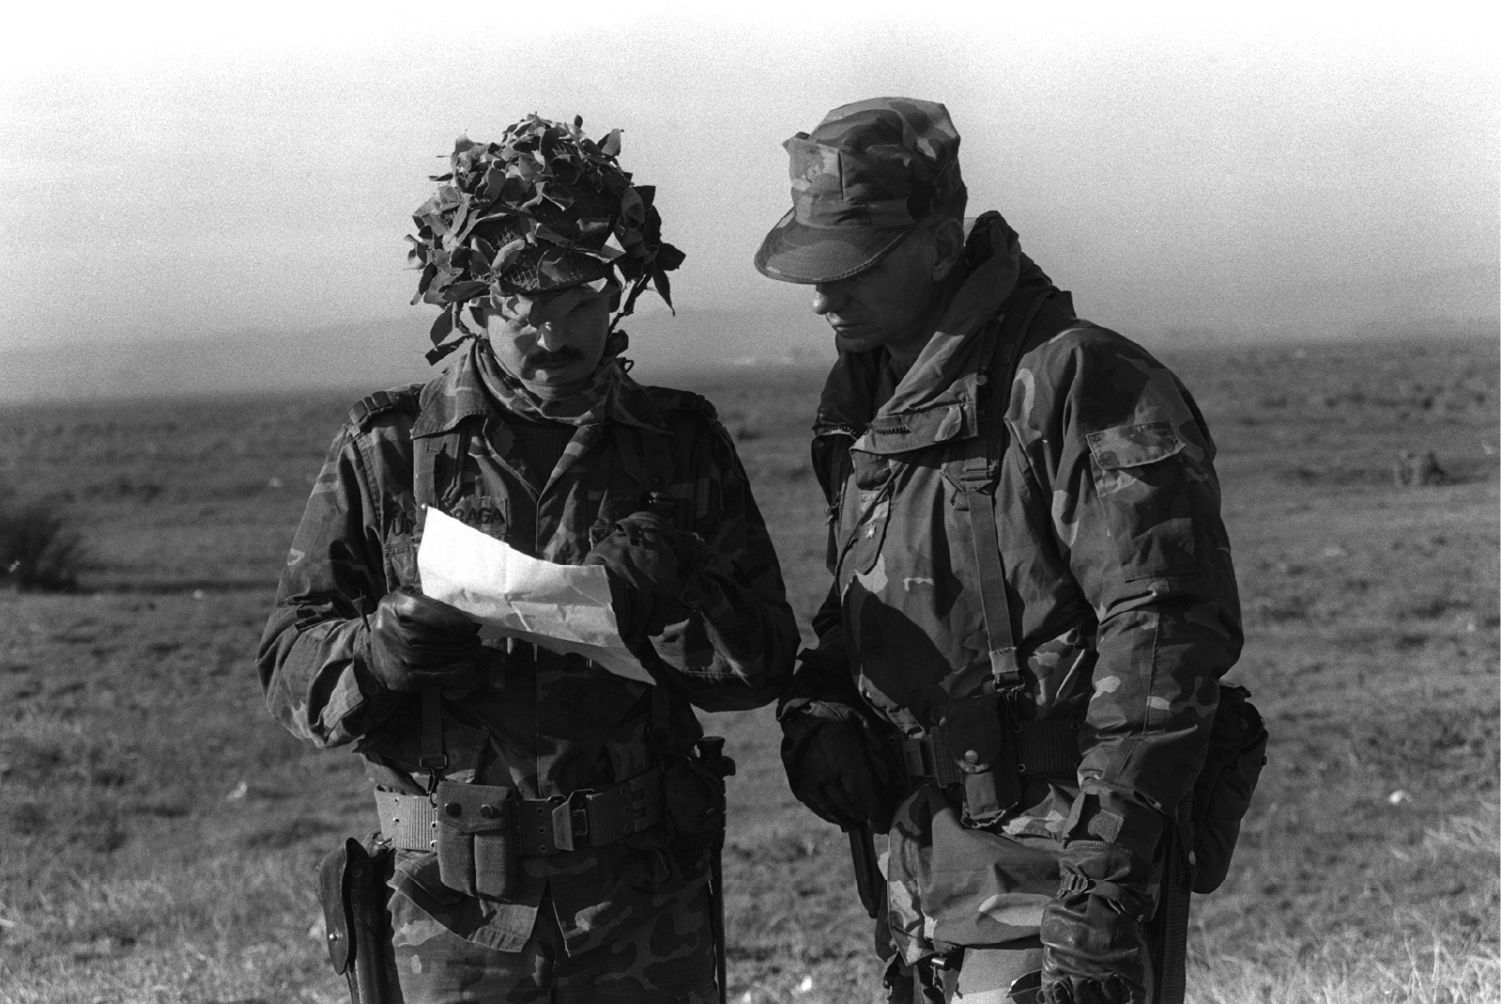
© National Archives photo no. 6487987, Public Domain.
When a movie character says to their fellow soldiers, hikers, shipwrecked friends or siblings “Let’s split up. You go that way and I’ll go this way,” it’s a pretty good bet that something bad is about to happen. Why? Because intuitively we all know that splitting up a group makes it harder for everyone to maintain the same understanding of the situation, which in turn makes it easier for them to fall victim to any number of movie-type problems like being irreconcilably separated, eaten by an animal, captured, injured or wandering into a magic wardrobe and imprisoned by a Turkish-delight-proffering evil witch.
Of course, one of the best ways for a group to maintain a shared understanding of their situation—whether they split up or not—is for each person to have an accurate map and refer to it periodically. Returning to the movie example for a moment, if the line “Let’s split up…” is a harbinger of doom, then a character spreading a map out on a stump and saying “This is our current location…” just as often foreshadows a positive turn of events. It suggests that the team has a shared understanding of their location, direction and progress.
Maps Reveal Hidden Insights
In the 1990s, I played college soccer as a midfielder—which meant playing both offense and defense for 90 minutes. I covered a lot of distance every game, but because GPS devices were neither small nor widely available it was impossible to know exactly how much distance. At the time, I estimated that I would cover around 3 miles in a 90-minute game—a mental model that has shaped my perception of soccer for the last 20-plus years. With the help of a map of GPS data, I recently discovered that my perception has been wrong.
In 2021, I began playing soccer again, now much older (let’s not talk about that right now) and wearing a GPS-enabled watch. After the first game, I was very surprised to learn that in only 77 minutes—which is twelve minutes shorter than the games I played in college—I had already run 5.42 miles. The game was also played on a shorter field with fewer players. Taken together, these facts show that in college I had been covering at least twice as many miles per game as I had estimated.
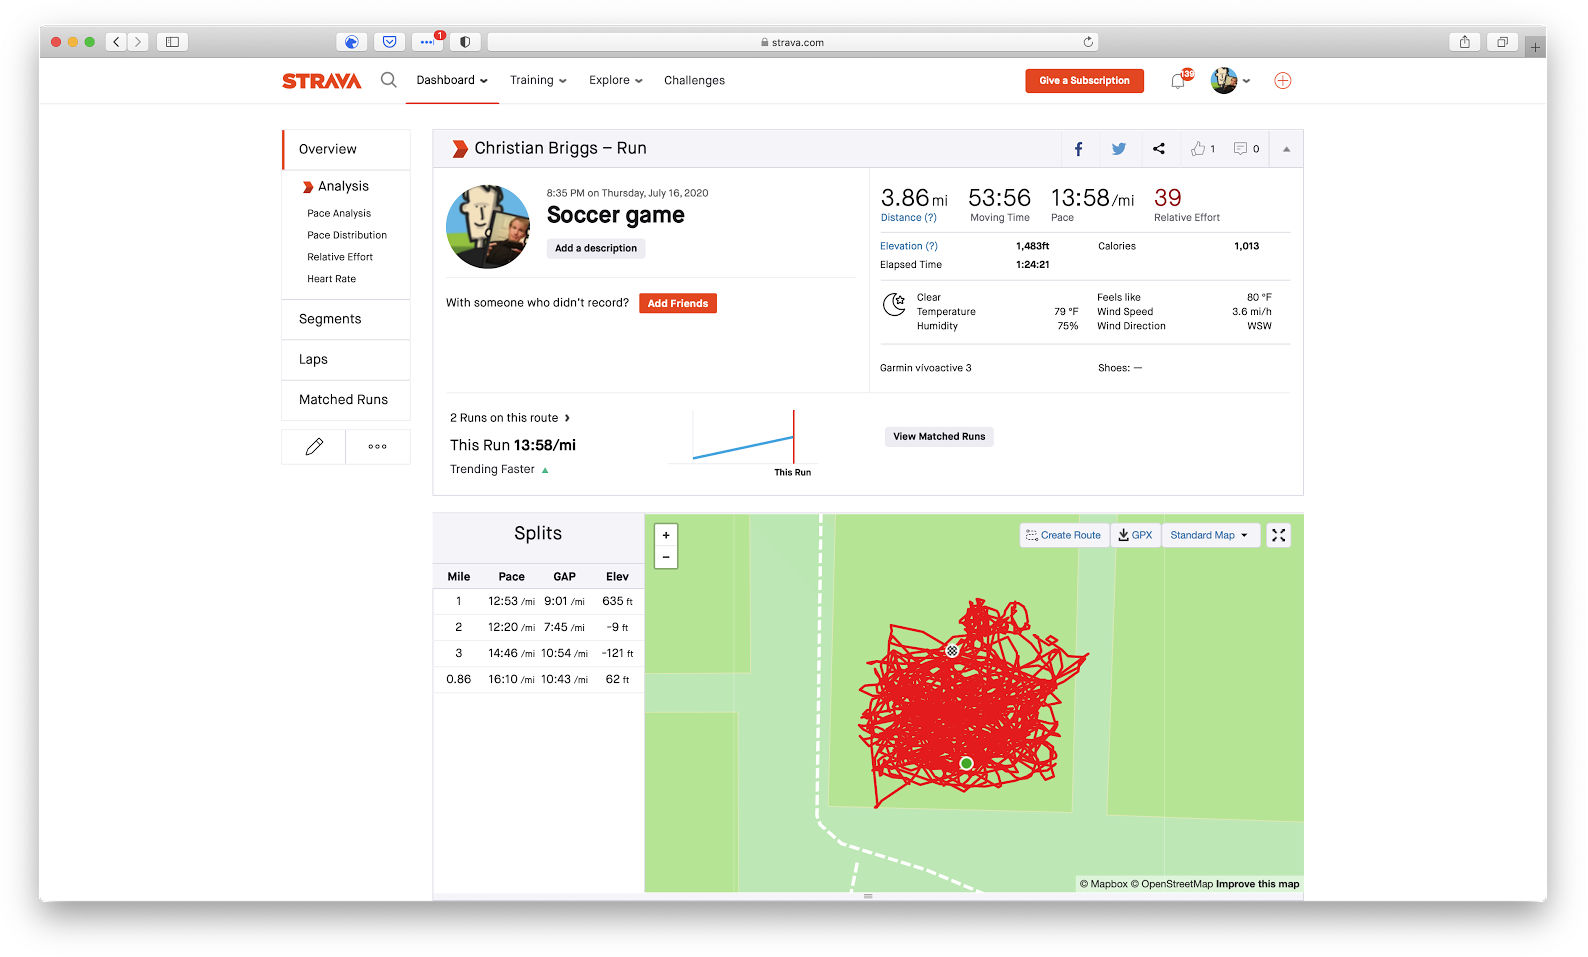
© Strava, Fair Use.
I could also see from the data that my path covered the entire field. This provided two otherwise hidden insights—that in college I was probably running much farther than 3 miles in a 90-minute game, and that I was still playing the game like a midfielder—playing both offense and defense—20 years later.
These are not life-changing insights, but they illustrate how maps can show patterns and data that reveal hidden insights.
Maps Help Us Coordinate Actions
On July 20, 1969, astronauts Neil Armstrong and Buzz Aldrin left Michael Collins in the Columbia Spacecraft, entered the Eagle Lunar Module, undocked and headed for a successful landing on the surface of the moon. For the next 28 hours, Columbia would orbit the moon. Eventually Eagle ascended from the moon’s surface, and on Columbia’s 27th orbit, it successfully docked again with Eagle.
The spatial, procedural and time coordination that this required was massive, as were the consequences for failure. Everyone involved—the three astronauts in space, the flight directors in Mission Control and everyone else in NASA—relied heavily on a range of specialized map visualizations to make sure that everyone understood exactly what to do and when.
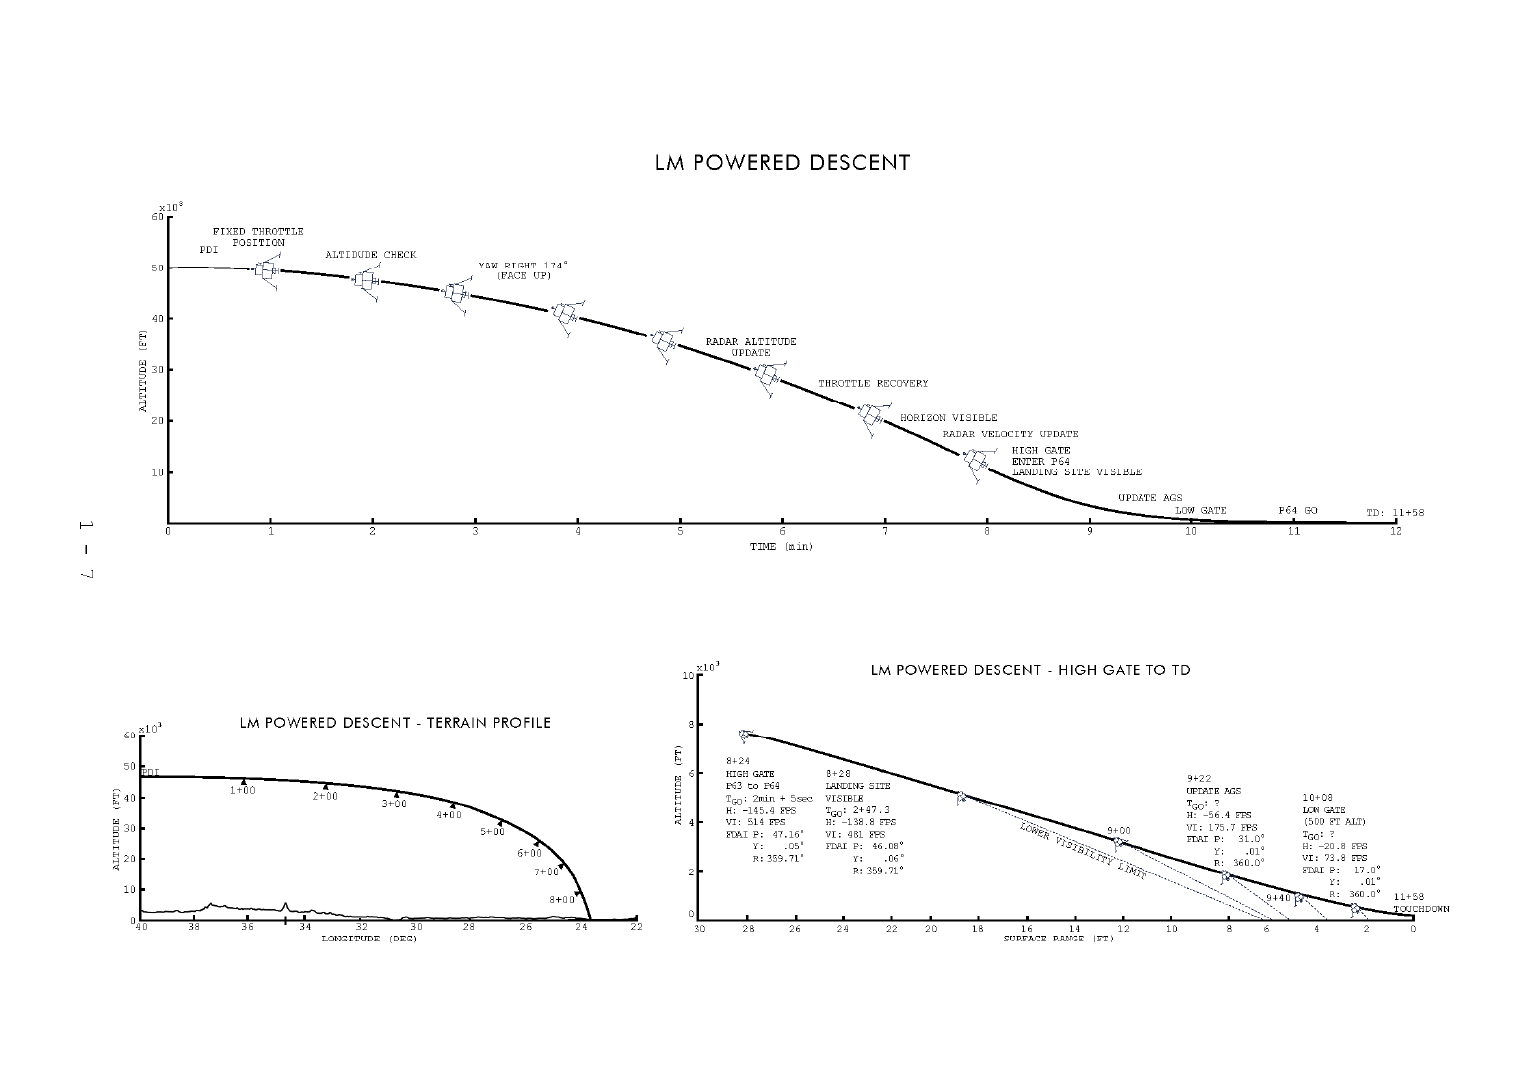
© NASA, Fair Use.
The maps used for the Apollo space missions illustrate another important point about maps. They help us to coordinate actions. The Lunar Module (Eagle) and the Command and Service Module (Columbia) used them to precisely plan their orbit, time their separation and plot a safe course to the moon, 70 miles away.
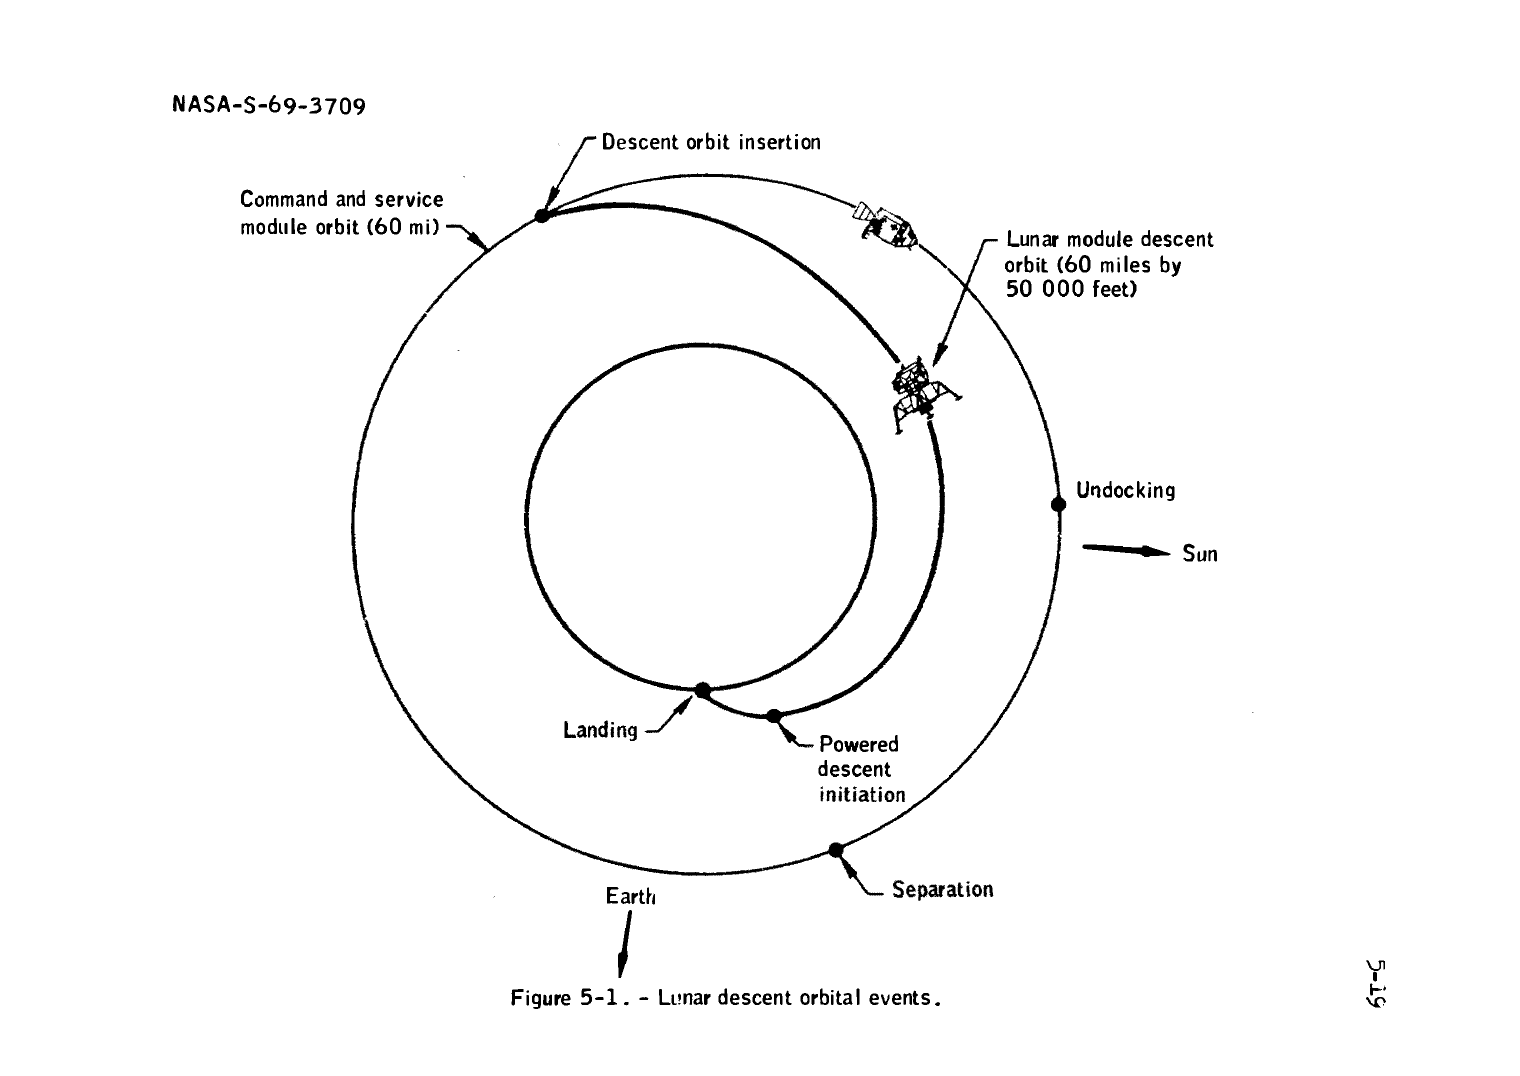
© NASA, Fair Use.
When the work on the moon was completed and the Lunar module lifted off from its surface, it had to perfectly synchronize its orbit in order to dock again with the Command and Service Module.
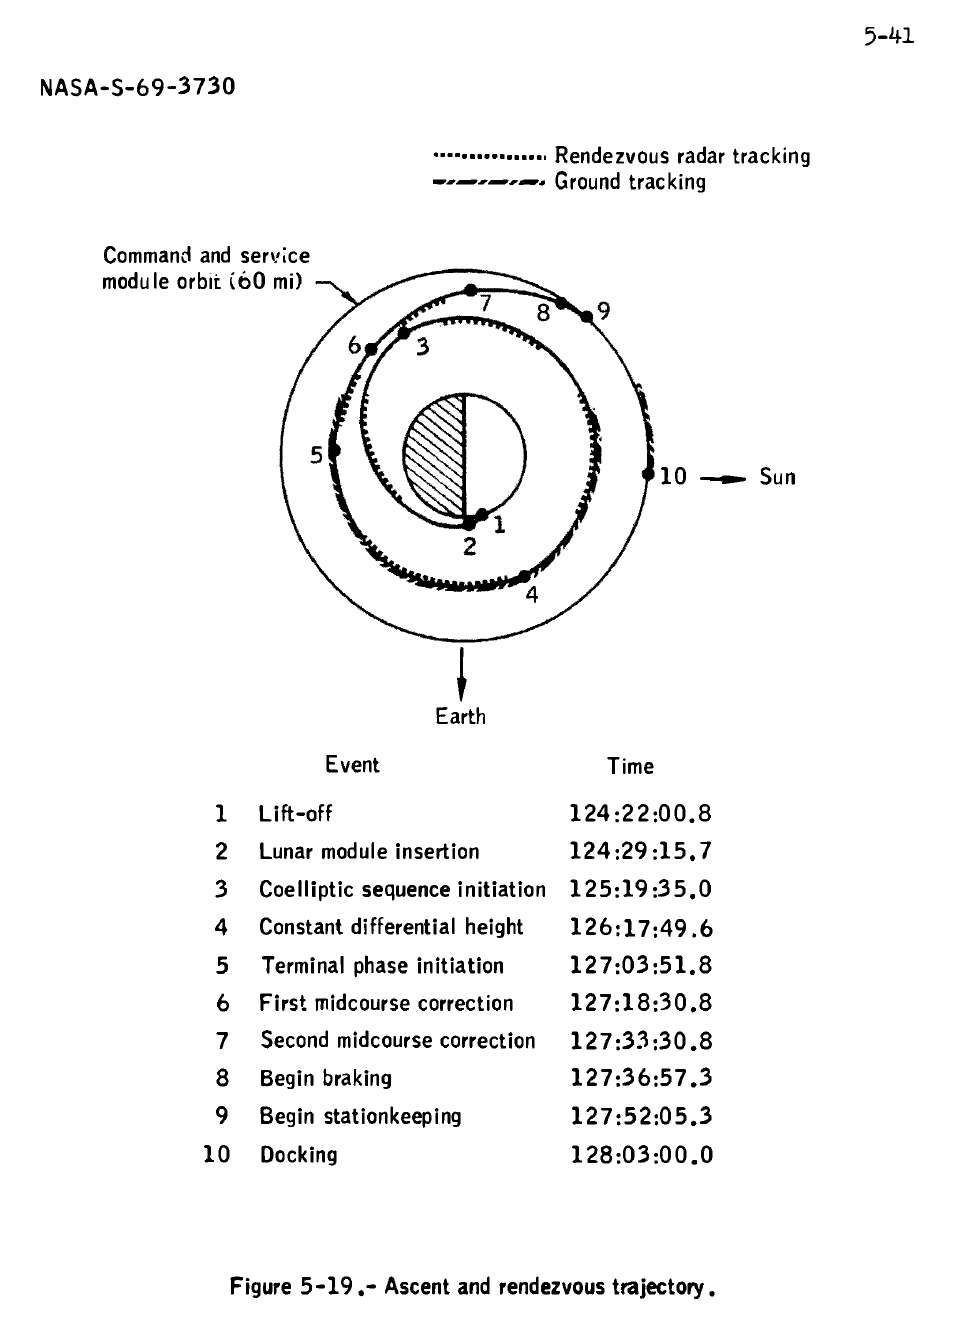
© NASA, Fair Use.
Meanwhile 200,000 miles away on Earth, Mission Control used the same maps to ensure that everyone stayed on course, on schedule and safely completed the mission.
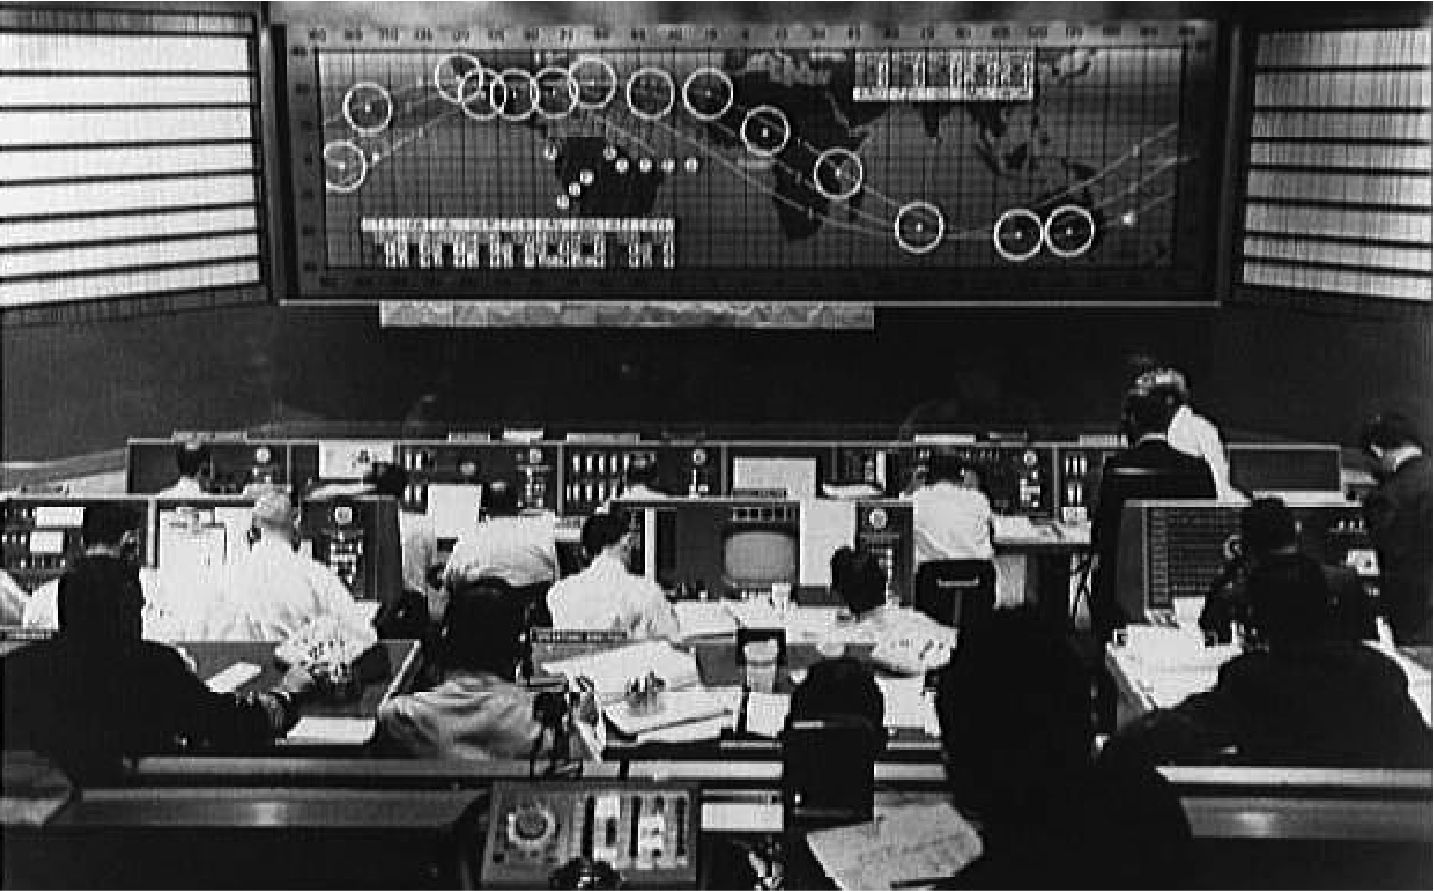
© NASA, Fair Use.
These examples illustrate two other features of maps. They simplified the complexity of space travel by showing only the things needed for the mission, and helped the Astronauts navigate in an unfamiliar environment that none of them had actually seen before.
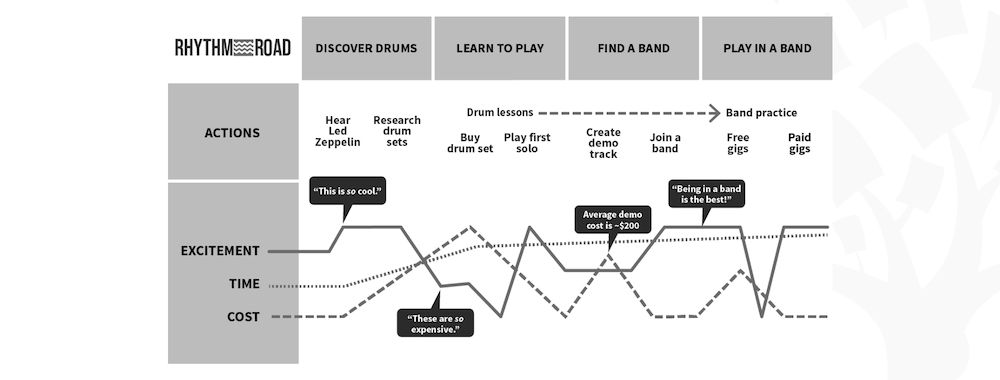
The Power of Journey Mapping in UX
As UX designers, we can learn valuable lessons from each of these examples! We can use the ancient power of maps—through the modern process of journey mapping—to reduce the complexity of a long-term fitness app experience, allow the owner of one part of a digital finance experience to create a shared understanding of another owner’s part, reveal hidden insights about how to improve a multi-person online game and help coordinate our actions with developers, support people, product managers and marketers and produce great design outcomes.
These examples should also give you confidence. If the massive metropolis of New York City can be simplified to a useful transit map, if a 20-year-old question can be answered by a map of one soccer game, and if NASA was able to use maps to successfully send three humans on a 900,000-mile round-trip to the moon, then surely you can use a journey map to help your design team create a better user experience!
The Take Away
The map is one of the earliest and most important human inventions. Mapping allows you to simplify a complex space, create shared understanding, reveal hidden insights and coordinate actions. Journey mapping allows you to use the power of maps to solve modern UX design challenges.
Images
© Interaction Design Foundation, CC BY-SA 3.0