
This post contains affiliate links. We may earn a commission if you click on them and make a purchase. It’s at no extra cost to you and helps us run this site. Thanks for your support!
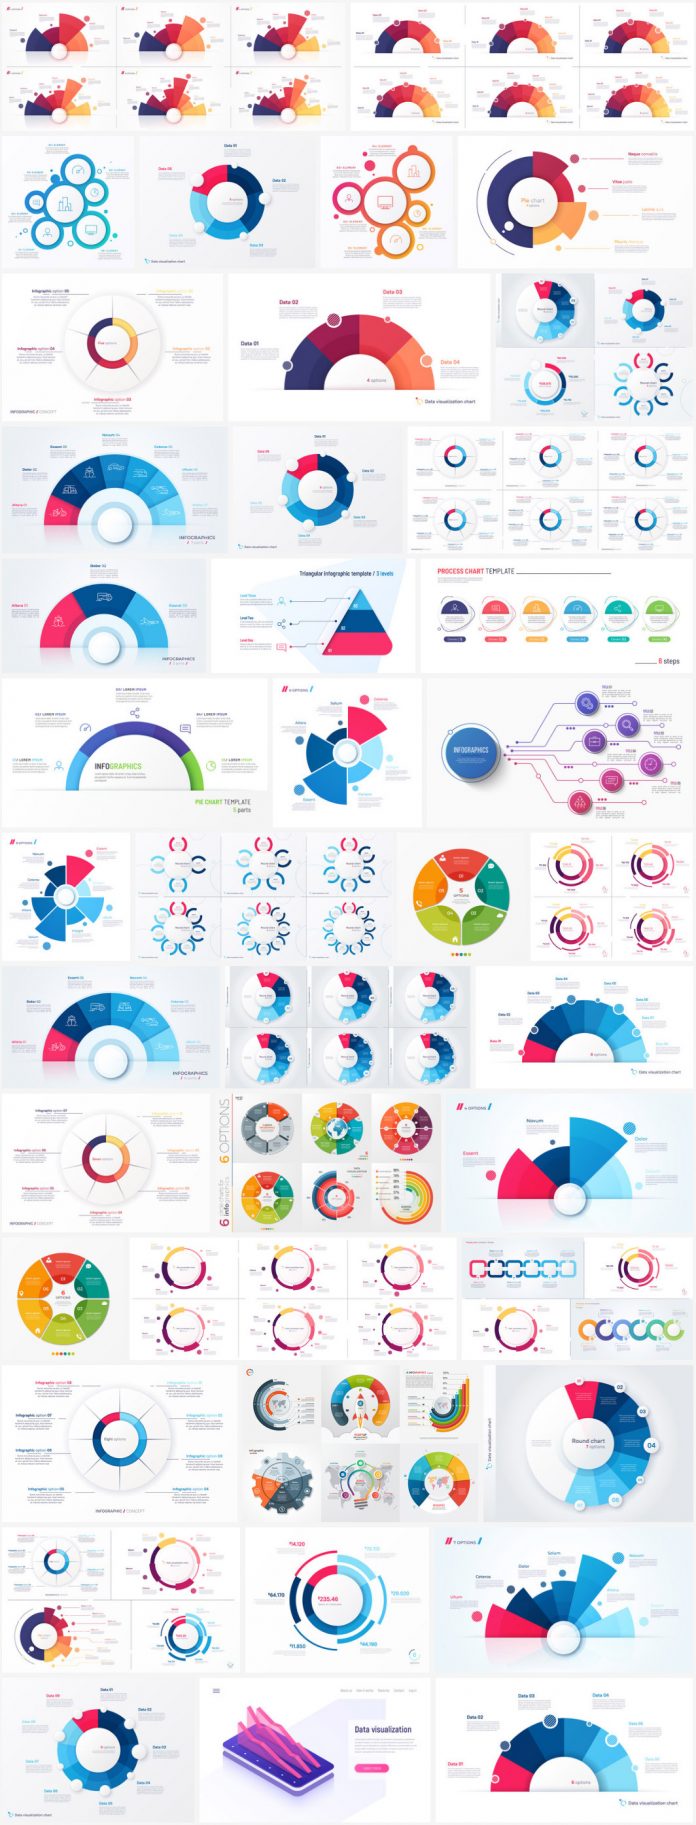
Check out this amazing collection of well-designed circular vector charts that can be used to create eye-catching web elements and infographics.
Designed by Adobe Stock contributor @rikkyal, this amazing collection includes a wide range of circular vector charts that can be used as templates for diverse web elements and infographics. These vector graphics are fully editable. This way, you can change them according to your own design principles and data. The collection includes a great variety of different styles to give you everything you need to create the perfect infographics for your website, mobile app, or any other user interface design.
Please note, these vector graphics require professional graphic design software such as Adobe Illustrator. You can get the latest version from the Adobe Creative Cloud website, just have a look here. Below you can see only a small selection of vector charts. Just click on the following link to see the full collection.
Are you interested to see more design assets? If so, feel free to browse through our Templates category. In addition, you can find trending typefaces in our Fonts category.
Subscribe to our newsletter!


