
Learn Information Design: Infographic Storytelling in Adobe Illustrator
We And The Color
NOVEMBER 19, 2022
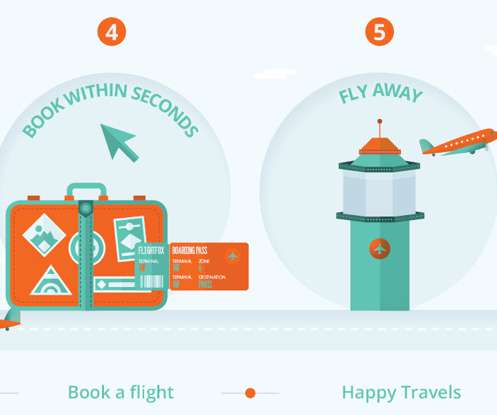
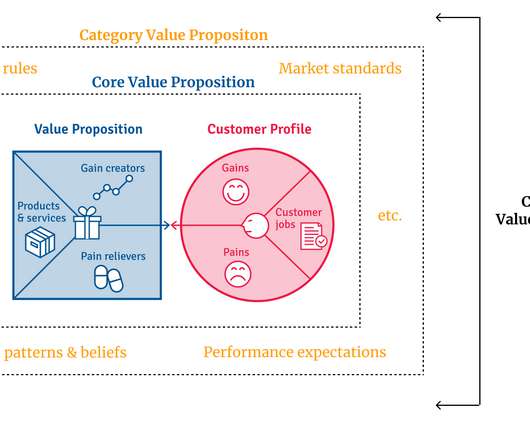
Data visualization is a powerful tool that can help you make sense of complex data sets. In this course, you’ll learn how to turn data into beautiful and easy-to-understand infographics. As writing and storytelling, data design is an integral way to communicate information in a digestible, visually-appealing way that encourages the viewer to learn more.


Let's personalize your content