9 Useful Chrome DevTools Features for Developers
Google Chrome’s built-in Chrome DevTools are a treasure trove for web developers. These tools enable you to modify web pages in real time, identify issues swiftly, and streamline the process of creating top-notch websites.
Chrome DevTools are not just debugging tools; they’re a comprehensive suite of utilities designed to inspect website code, execute scripts, track network requests, and enhance your web application’s performance.
This article unveils 9 useful Chrome DevTools features, each designed to simplify and enhance your web development experience. Whether you’re a seasoned developer or just starting out, this set of features will come in handy for debugging and coding.
1. Unminify JavaScript for Easier Debugging
Minifying code is a common practice that greatly reduces file size by removing unnecessary spaces and indentations. While this makes files smaller and faster for browsers to load, it can turn into a nightmare for developers to read and debug. Chrome DevTools simplifies this process with its unminify feature.
- Open Chrome DevTools.
- Navigate to the “Sources” tab.
- From the left file explorer tab, select a minified JavaScript file.
- Click on the
{}icon located at the bottom of the file editor. - The file will be unminified, making it easier to read and debug.

2. Record and Play User Flow
For developers, testing how a website responds to different user journeys is crucial. These user flows represent the paths that users take while navigating your site. Manually testing these flows can be tedious, requiring repetitive actions to simulate user behavior.
Chrome DevTools offers a solution by allowing you to record and replay user flows. This feature saves considerable time in optimizing your code for various user interactions. It also helps in measuring key metrics related to these flows.
To record a user flow:
- Open Chrome DevTools and go to the “Recorder” tab.
- Start a new recording by clicking the “Create a new recording” button.
- Give the recording a distinctive name for easy identification.
- Press the record button.
- Perform the desired user actions, such as button clicks and page navigations; these will be captured.
- Once completed, click the end recording button.
- The recorded user flow is now ready for automated testing, eliminating the need for manual repetition.
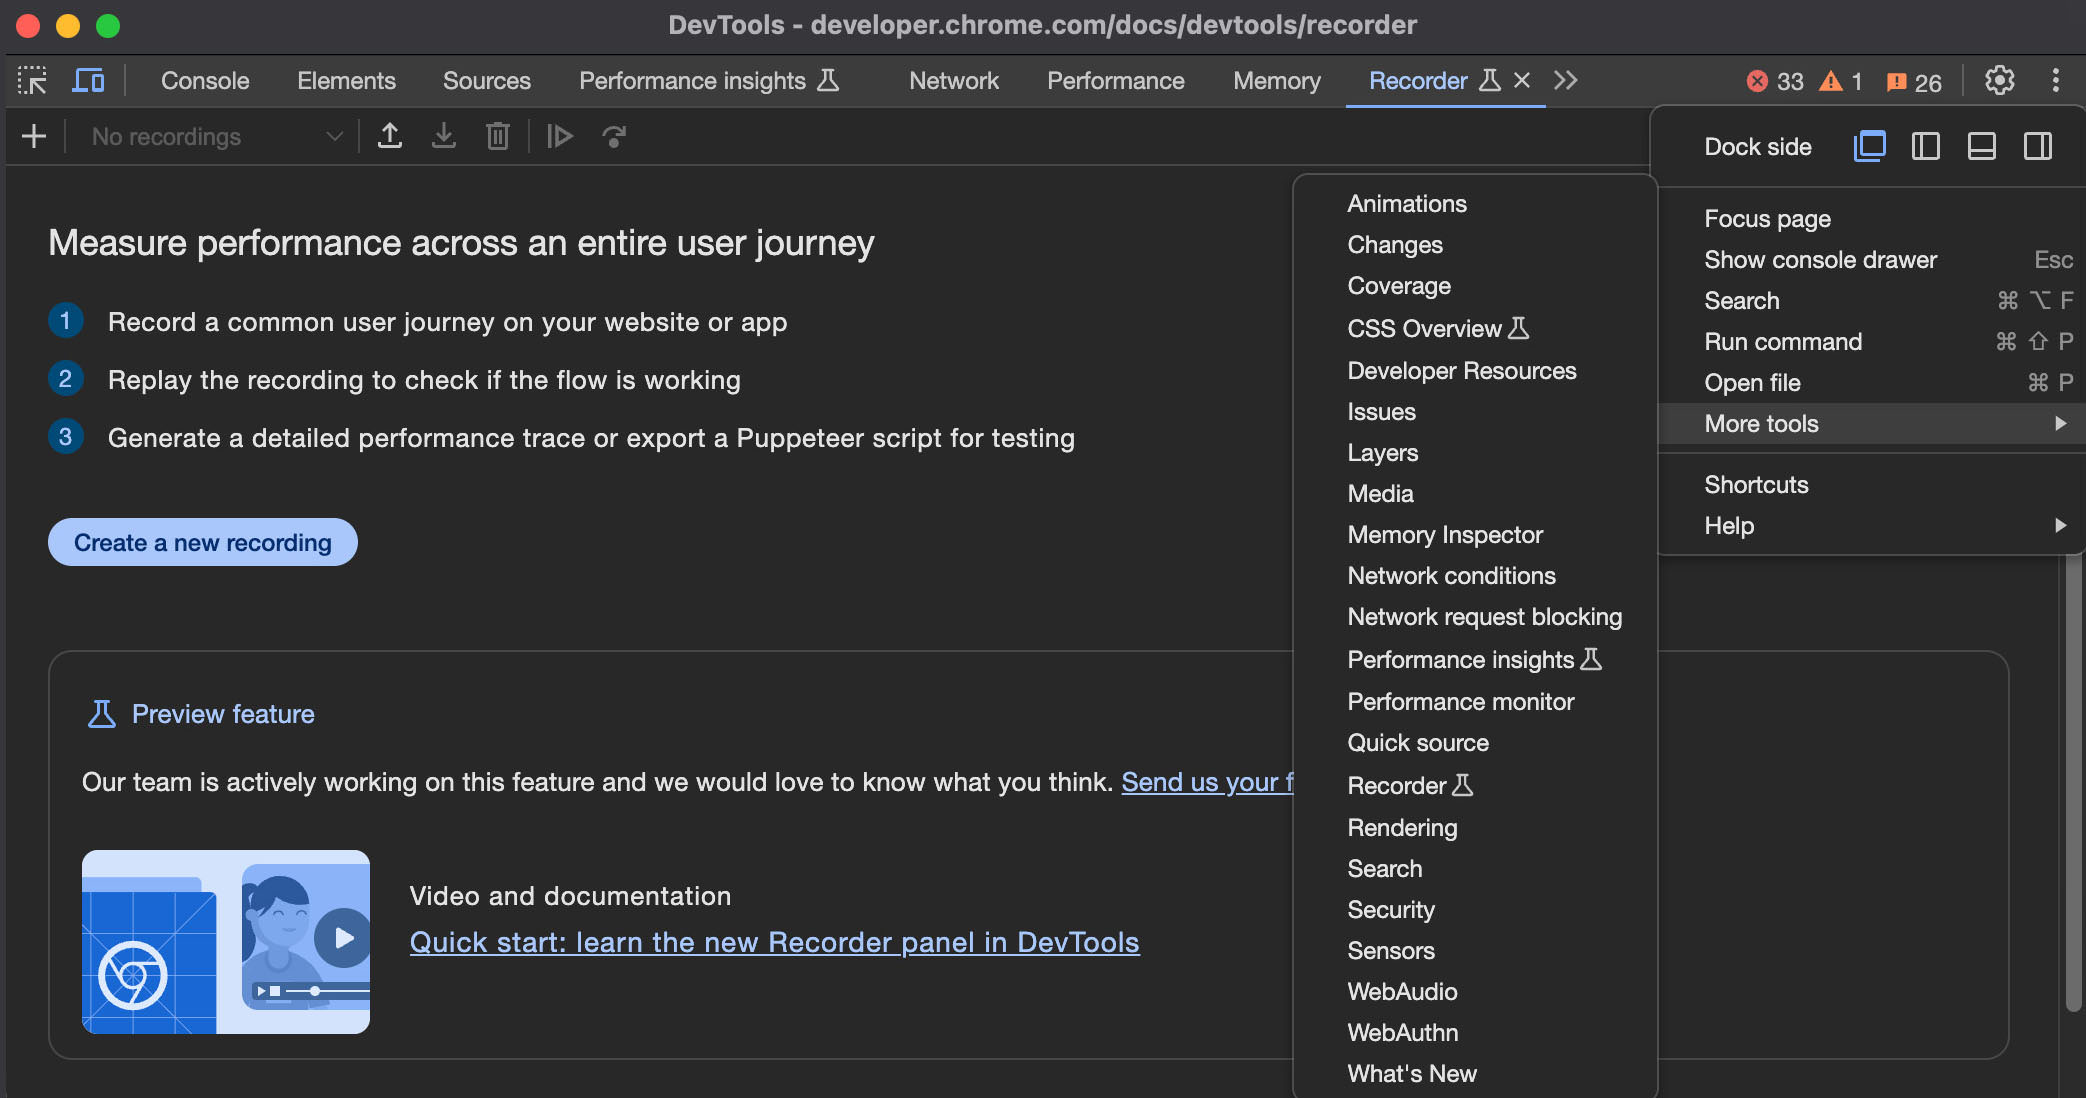
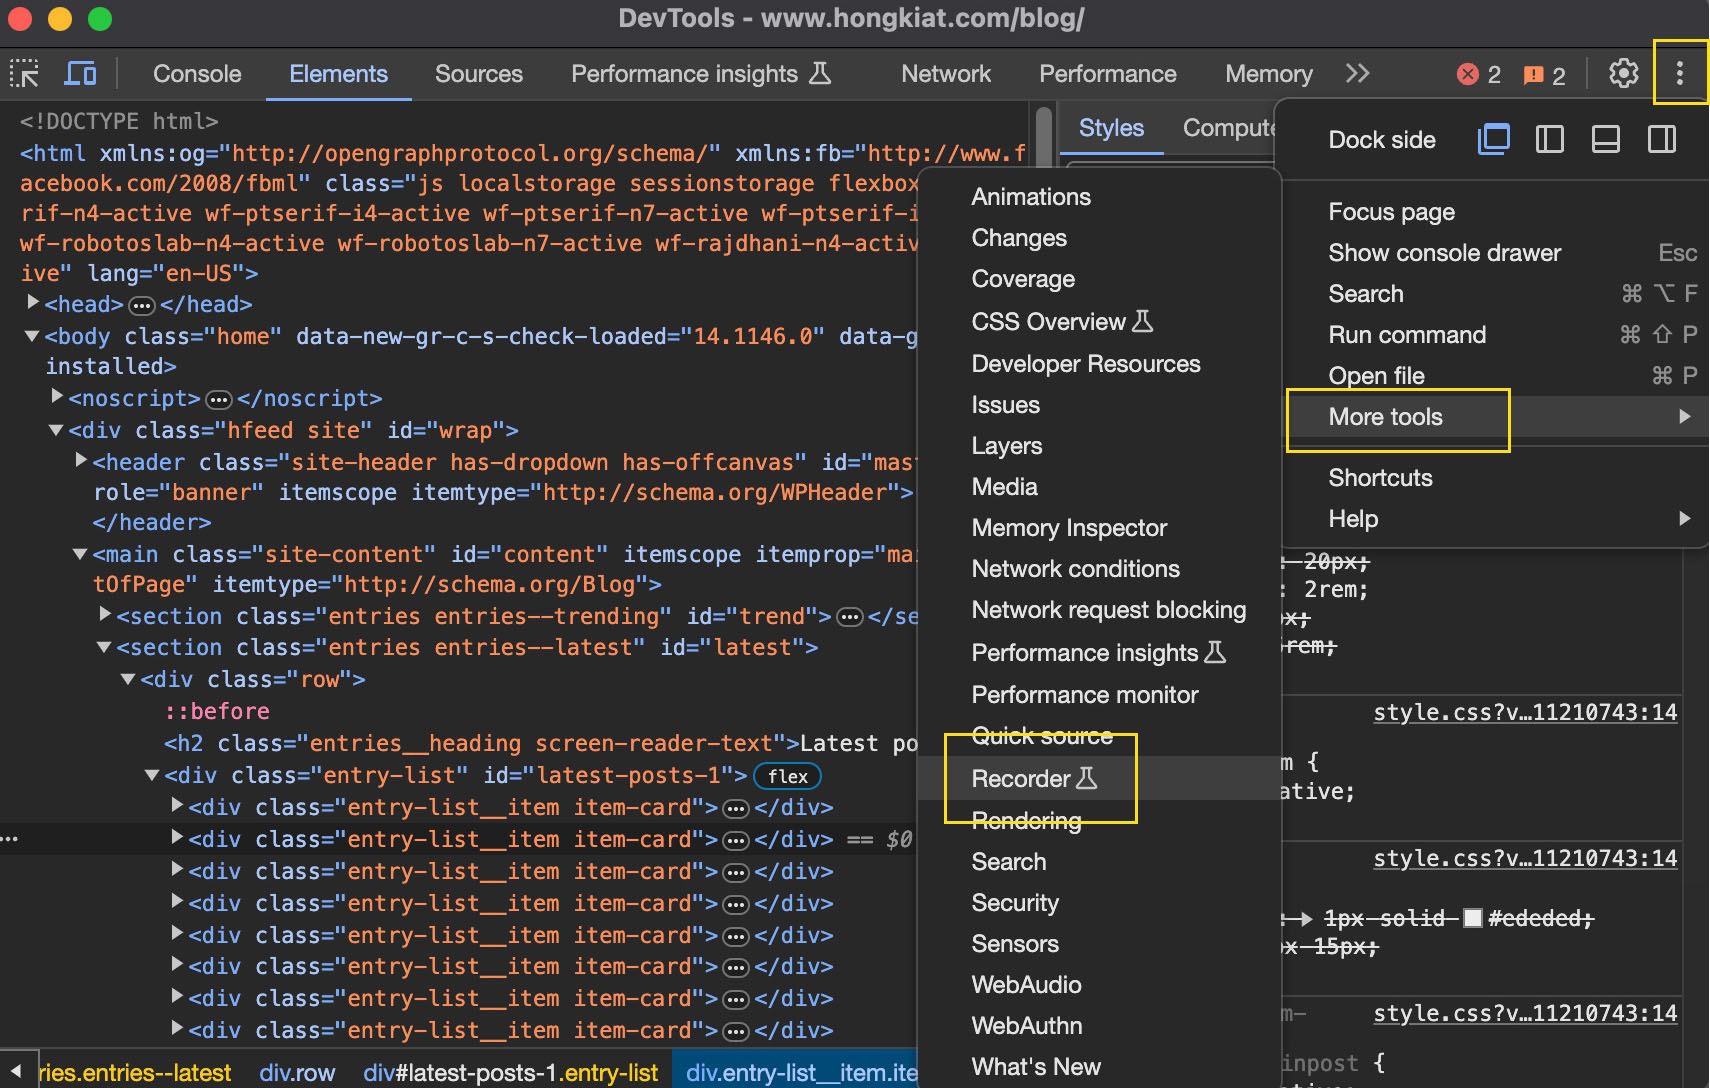
If the “Recorder” tab isn’t visible, click on the triple dot icon at the top right, and then navigate to “More tools” > “Recorder”.
3. Filtering Network Requests
Chrome DevTools simplifies the task of filtering network requests.
- Open the “Network” tab in Chrome DevTools.
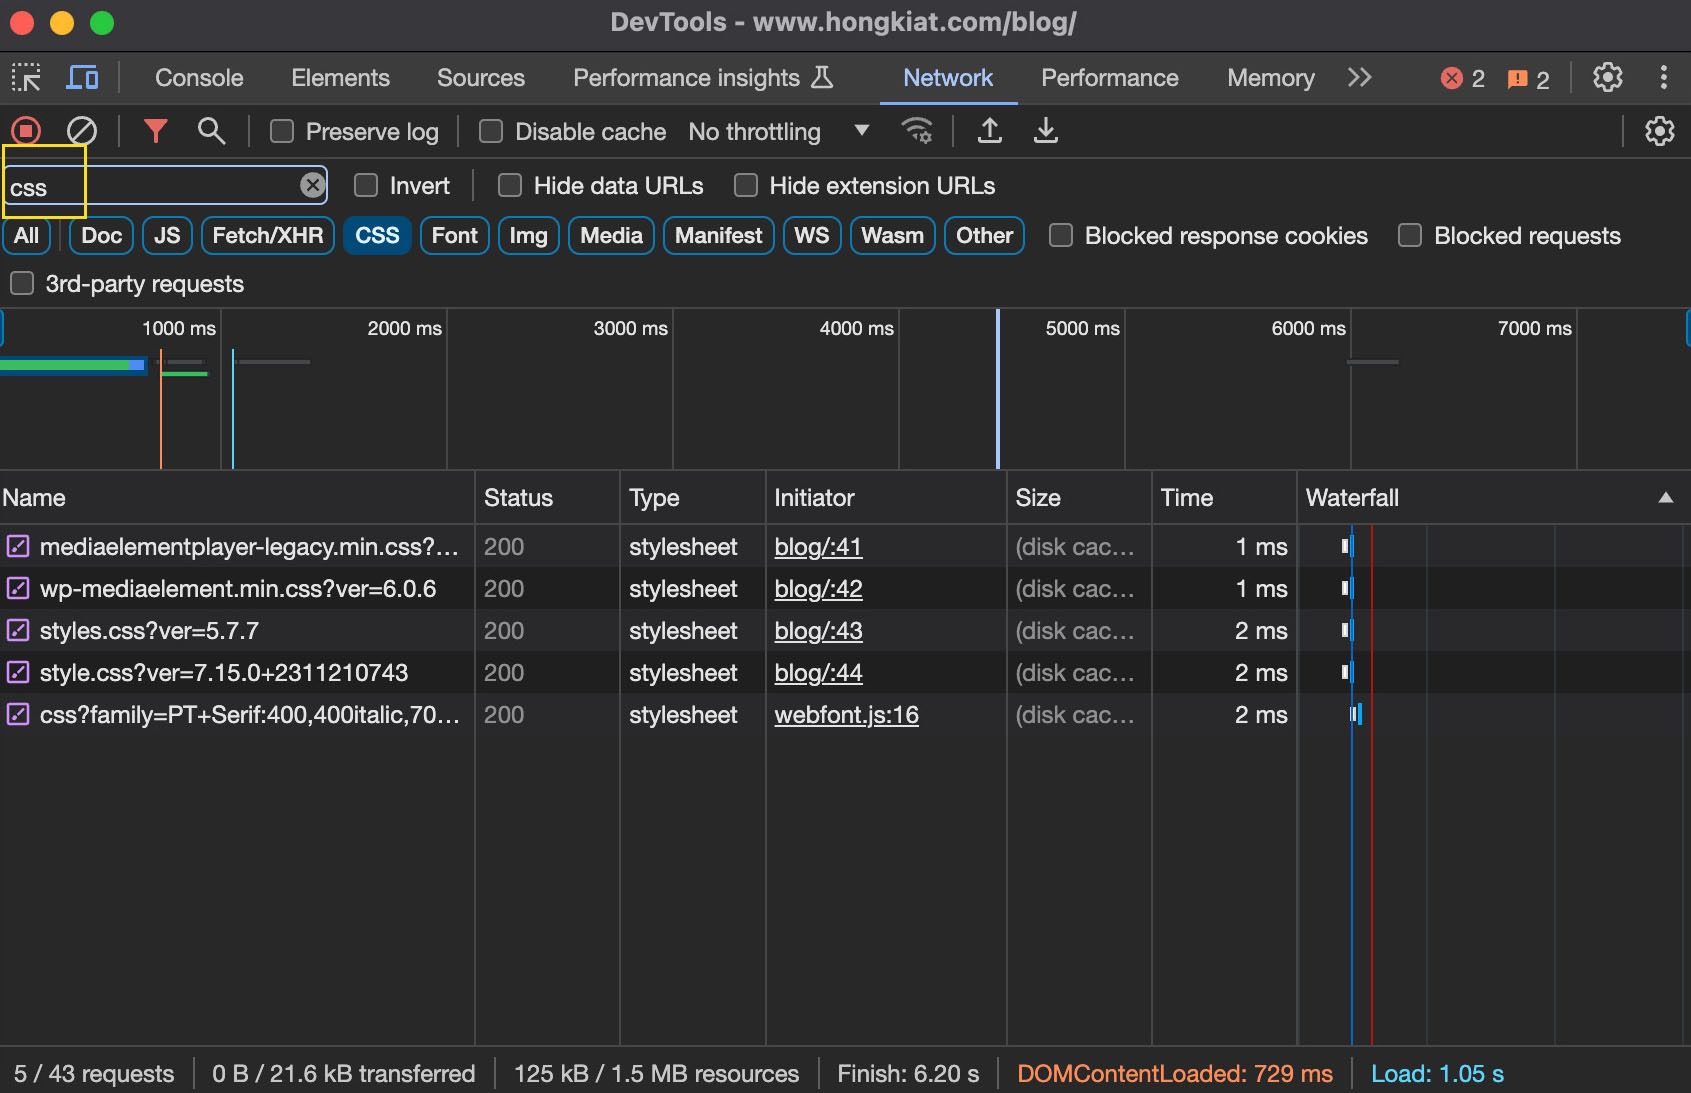
- Click on the funnel icon to access a range of filter options for the website’s network requests.
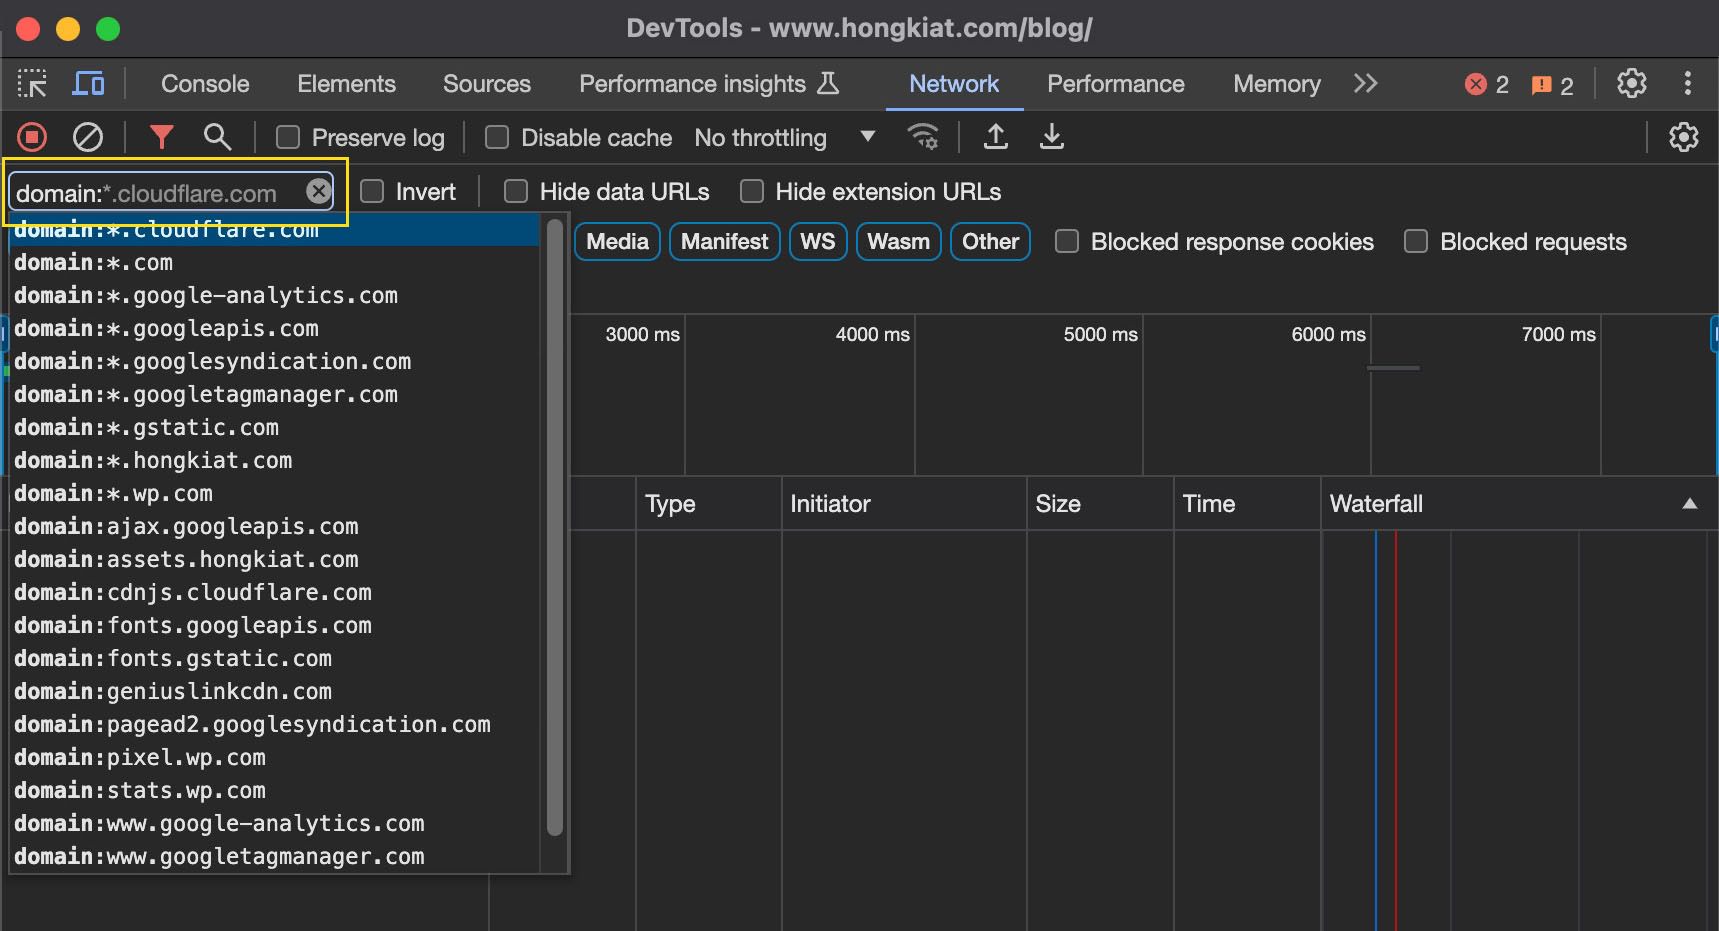
Filtering can be done by entering relevant text in the filter input. For instance, typing “css” will show only CSS files or files containing the word “css”. You can also use regular expressions for more specific searches.
For domain-specific filtering, enter ‘domain:’ followed by the domain name in the filter input. This will isolate requests to that specific domain, providing a focused view of network activity.
4. Network Speed Throttling
Understanding your website’s performance under various network conditions is essential. Chrome DevTools assists with this by providing network speed throttling options.
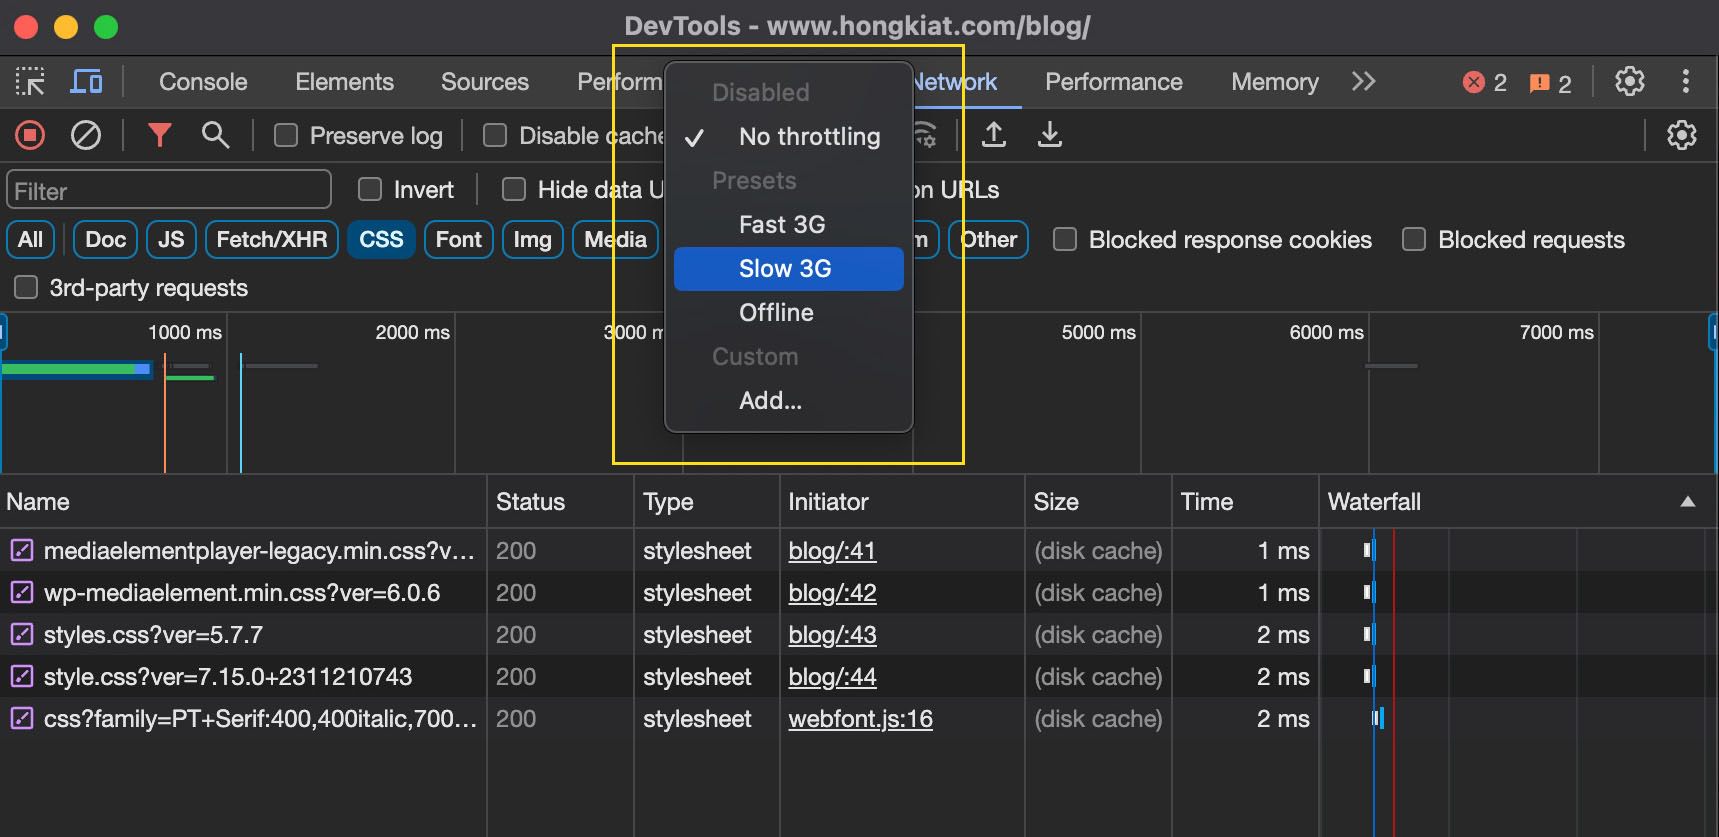
In the “Network” tab, you can find four default throttling options: No Throttling, Fast 3G, Slow 3G, and Offline. Testing your website with each of these settings helps you evaluate and enhance its performance, particularly under slower network speeds.
This feature is especially useful for developers of Progressive Web Applications (PWAs), as it enables testing the app’s behavior in offline scenarios.
5. Identifying Unused JavaScript
Chrome DevTools also made Locating unused JavaScript on your website is made easier, and here’s how:
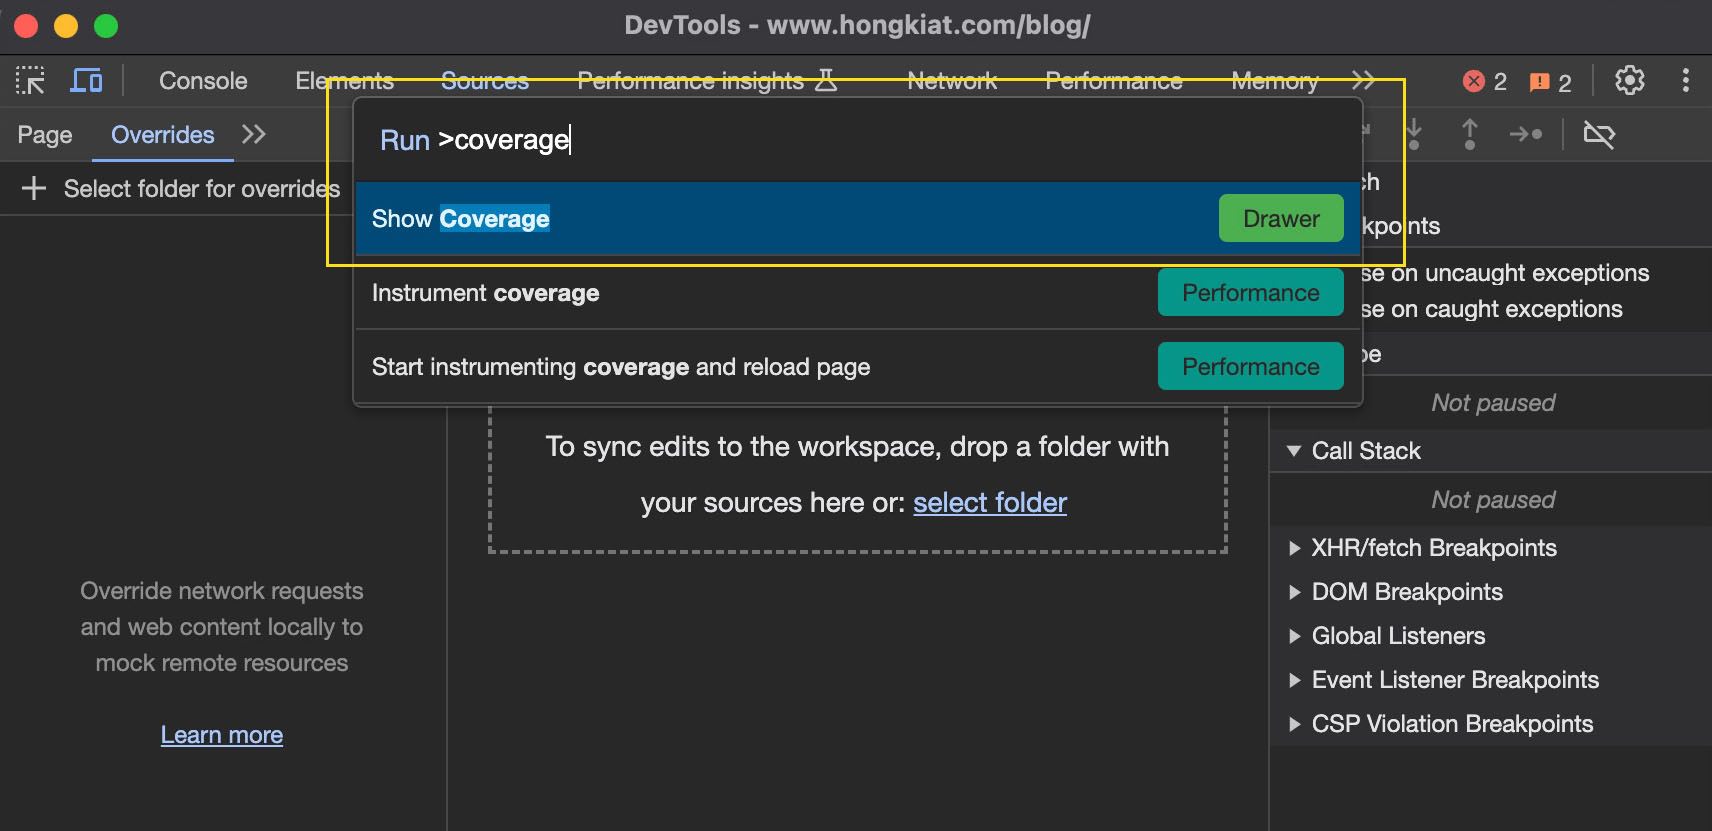
- Press Control + Shift+ P (Mac: Command + Shift + P)to open the command menu.
- Type “coverage” to access the Coverage tab.
- Click on the reload button in the Coverage tab.
- The tab will track all files and generate a coverage list, including a usage visualization graph for each file.
- Click on a row to display the unused code in the Sources tab.


6. Mobile Device Emulation
It goes without saying that all websites should be tested against their mobile layout. However, the vast array of smartphone sizes and resolutions makes it impractical for developers to test their web applications on every possible device.
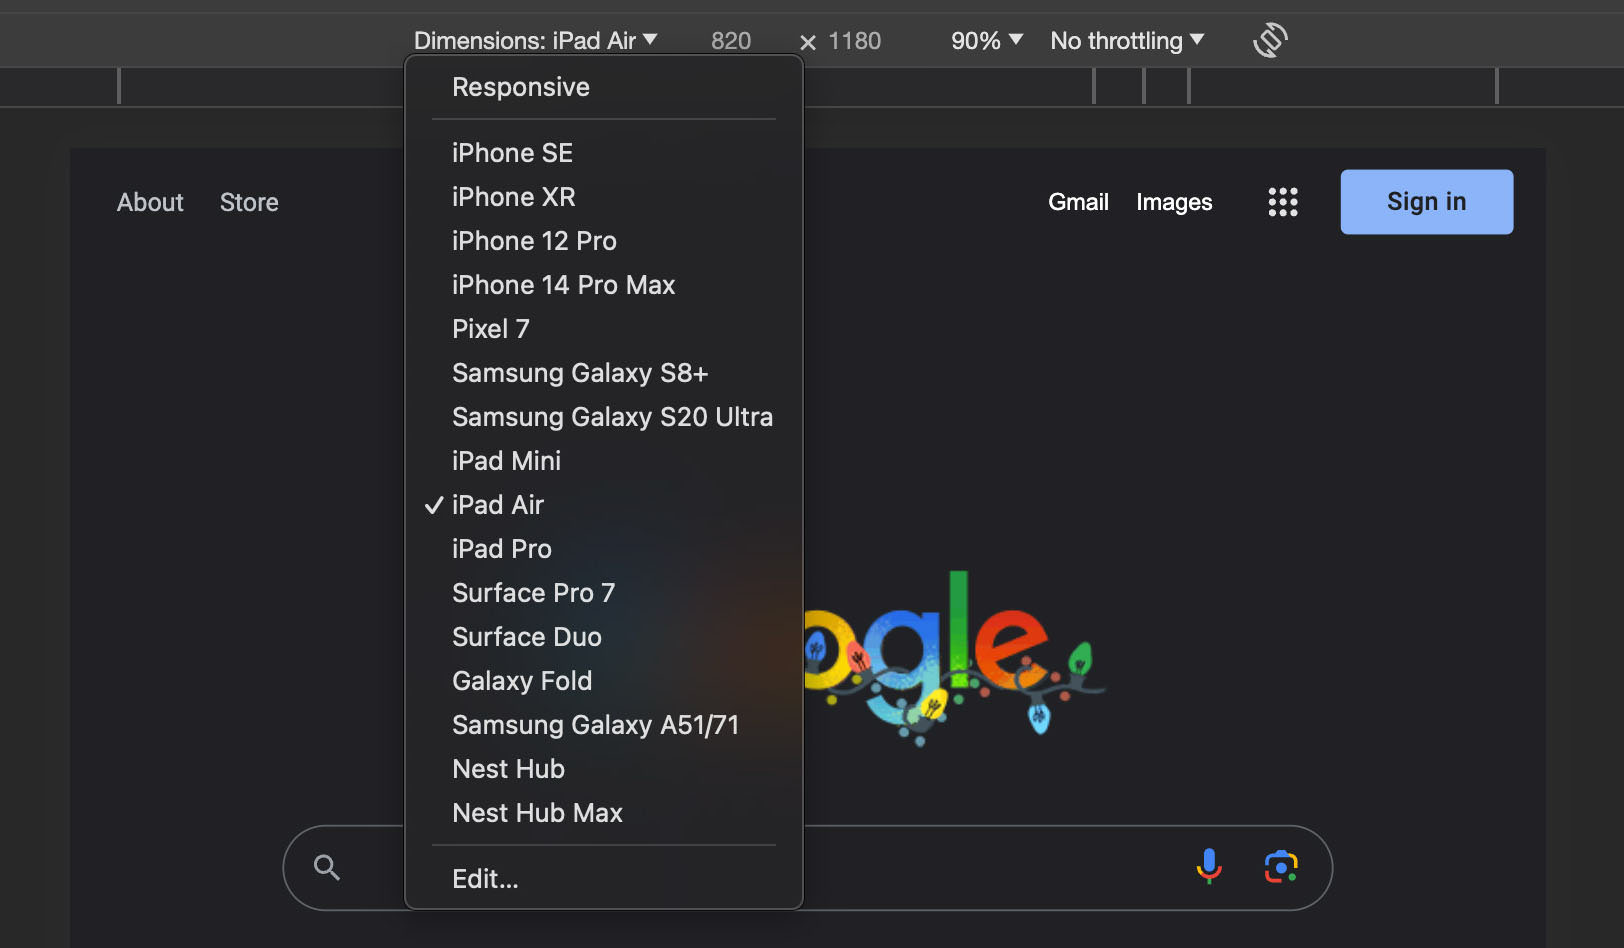
Chrome DevTools offers the ability to emulate a wide range of mobile devices, including iPhones, iPads, Samsung Galaxy phones, and more. For even greater flexibility, you can choose a variable resolution from the device dropdown menu, rather than being restricted to fixed screen sizes.
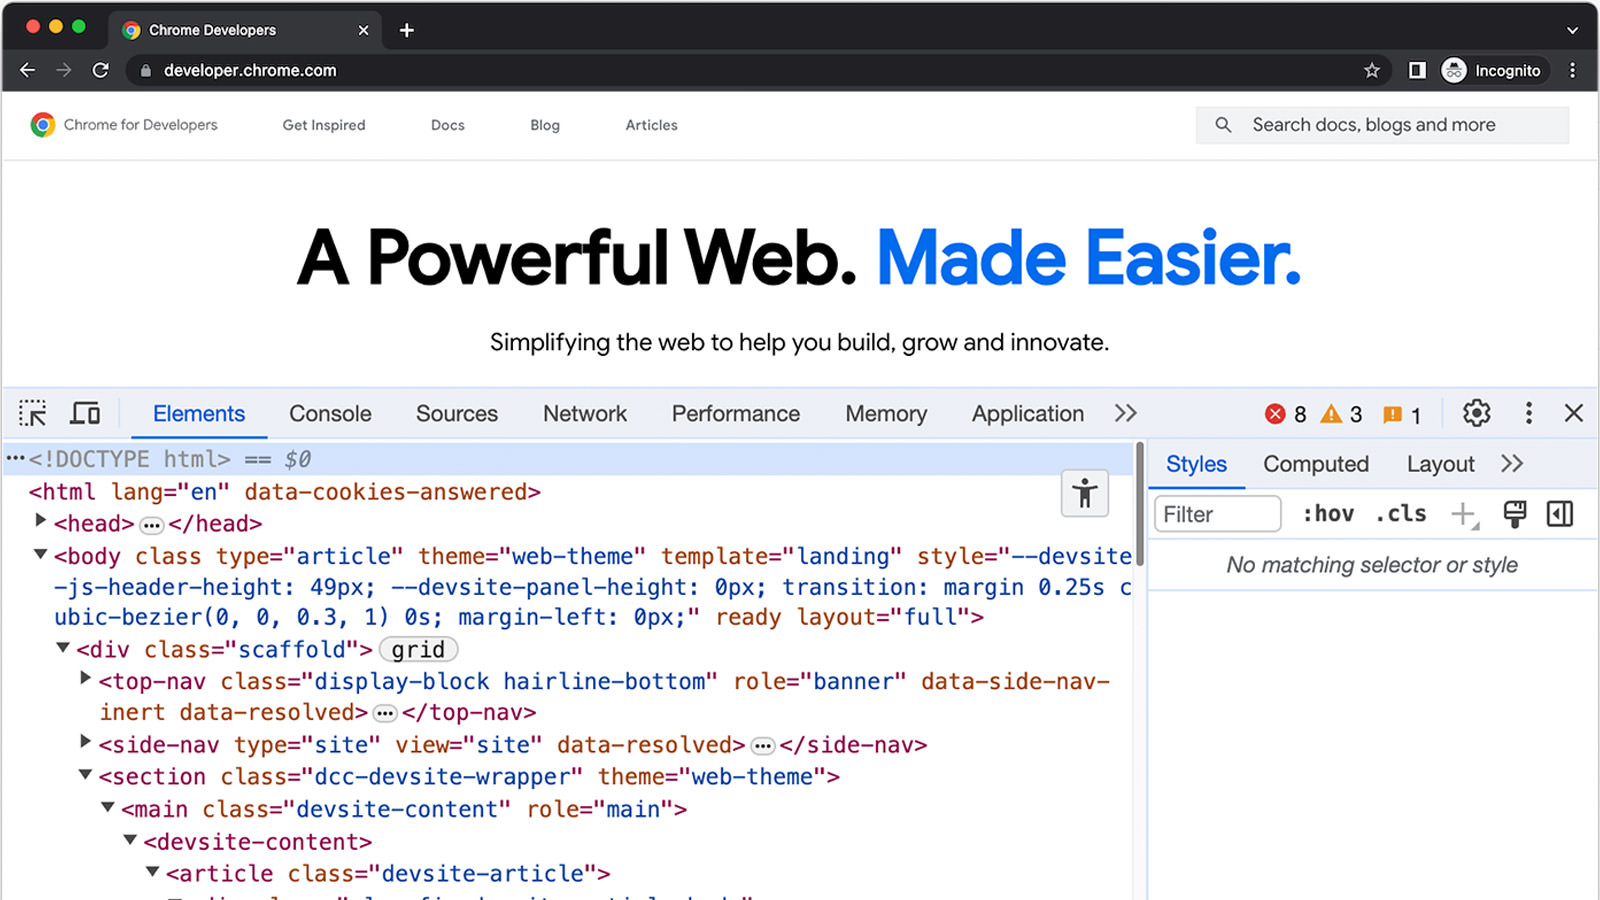
To use the device emulator, simply open Chrome DevTools and click on the mobile icon on the left side. From there, a variety of devices can be selected from the “device dropdown menu”, enabling comprehensive testing of your website’s mobile compatibility.
7. Re-running HTTP Requests
The “Network” tab in Chrome DevTools provides insight into the network requests made by a site. By clicking on any of these requests, you can view more details such as request headers and responses.
This feature is especially helpful for replicating and debugging requests. You can copy these requests and re-execute them in different environments.
To copy a request, right-click on it to open the context menu, and then hover over the “Copy” option. This action will display various choices for copying.

8. Managing Client-Side Storage
Websites commonly store client-specific data in your browser, each within its own isolated storage scope, invisible to other sites.
To access this client-side storage:
- Open Chrome DevTools.
- Go to the “Application” tab.
- Look in the “Local Storage” section.
- Here, you’ll find URLs of websites that have stored data in your browser.
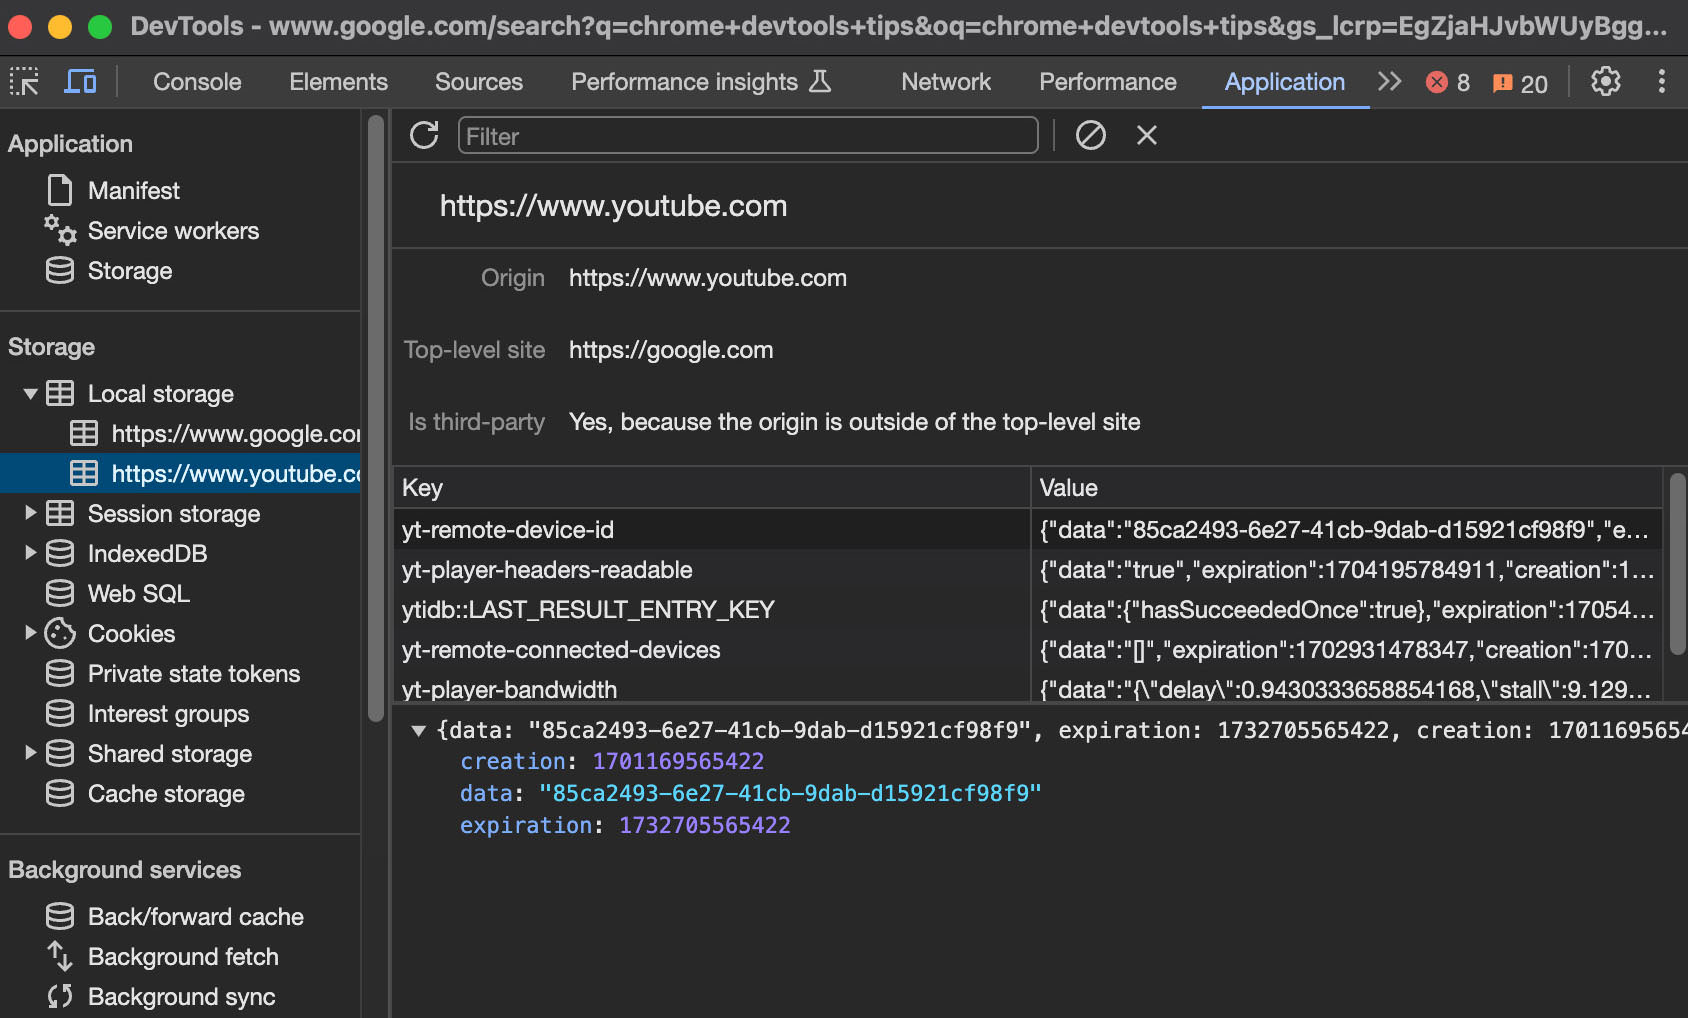
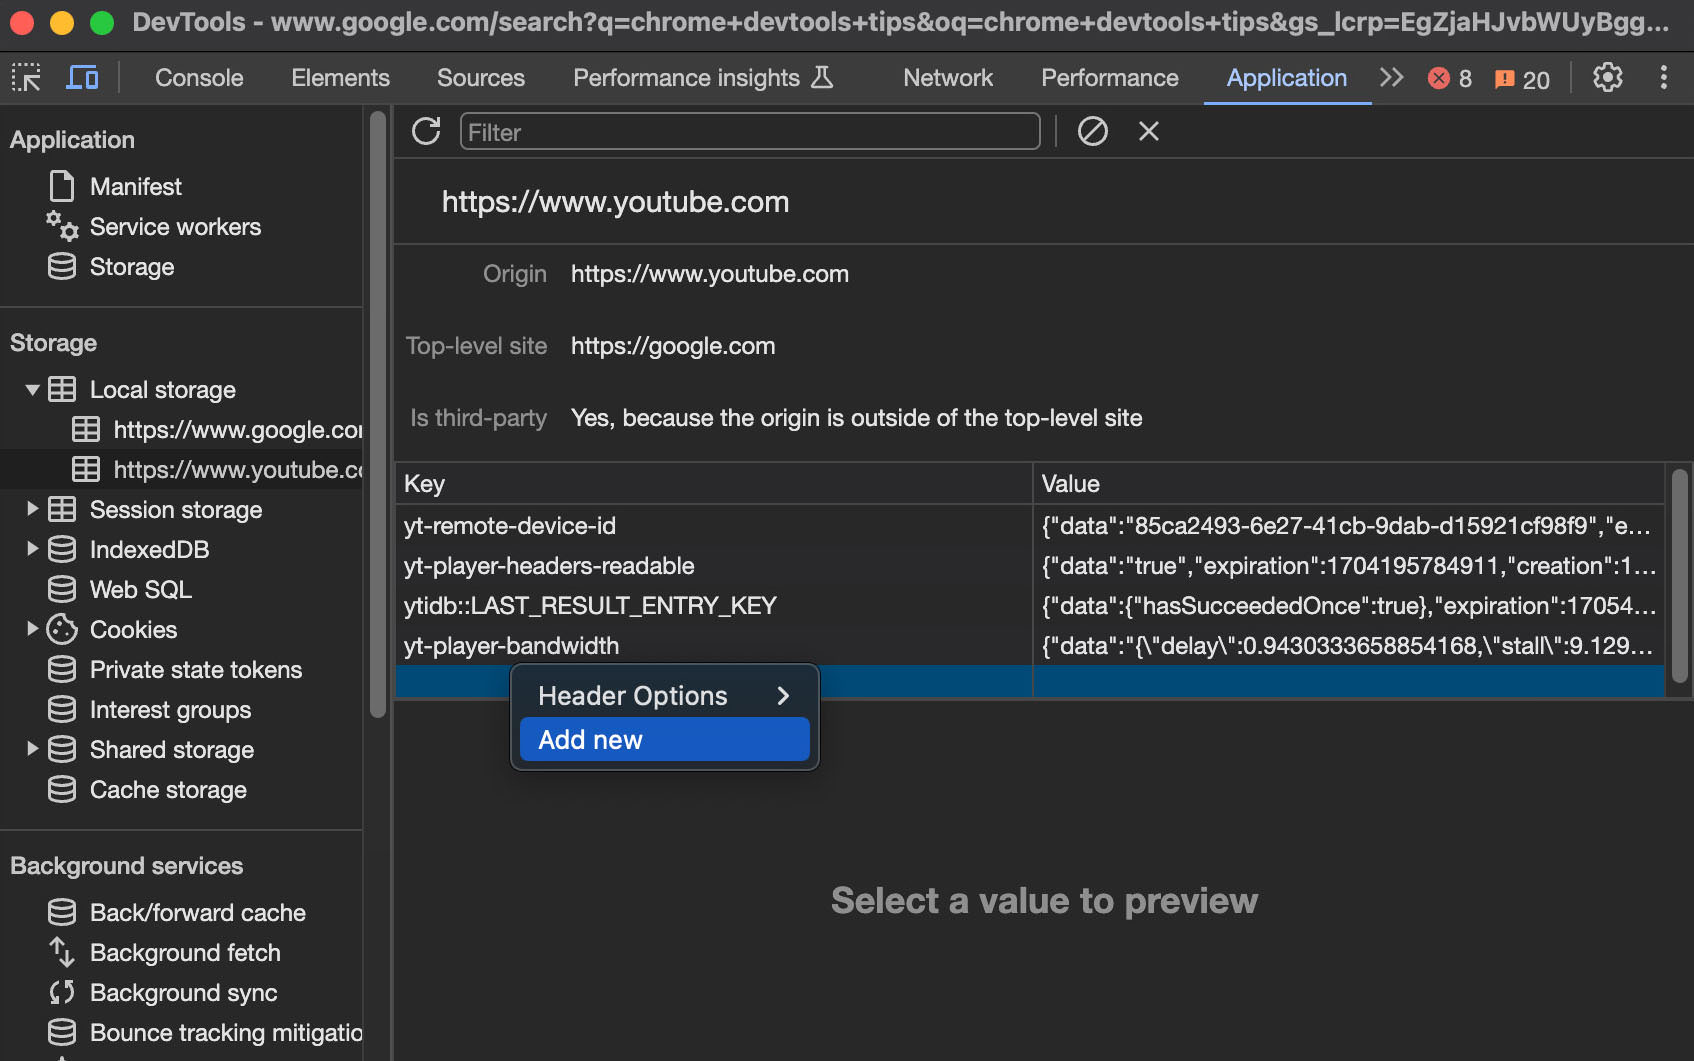
Clicking on one of these URLs reveals key-value pairs – the actual data these websites save for future use. You can easily modify this data by double-clicking on the key or value sections.
Alternatively, you can add a new key and value by scrolling all the way down in the key column, right-clicking, and then selecting “Add new”.
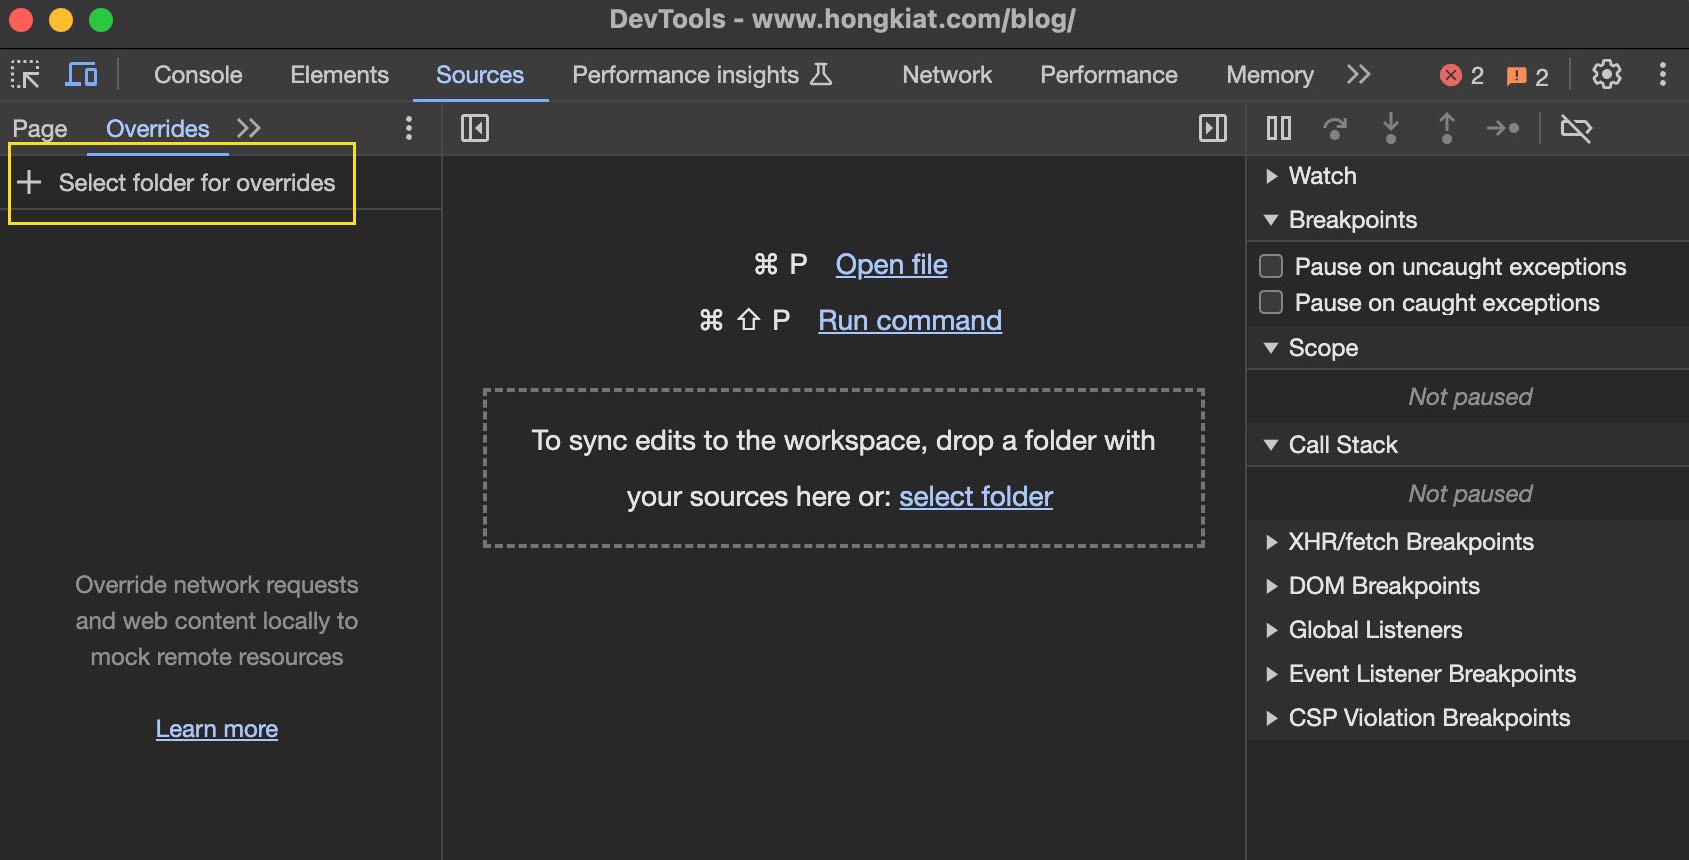
9. Enable Local File Overrides
Modifying a live production website carries risks, as errors can potentially bring down the entire site., and there’s actually there’s a safer way to test new ideas without altering the production code
This feature in Chrome DevTools allows you to use your locally modified files instead of the server-sourced ones. To activate local file overrides:
- Navigate to the “Sources” tab in Chrome DevTools.
- Click on “Enable local overrides.”
- Create a directory where Chrome can save all your overrides.
- Go to the “Network” tab.
- Choose a file you wish to override and select the “Save for override” option.
- The chosen file will then appear in the ‘Overrides’ tab within ‘Sources’.
- Here, you can edit the file as needed.
When you reload the page, Chrome will use your locally modified version, bypassing the server’s files and allowing for risk-free experimentation.
Conclusion
And there you have it! We’ve explored some of the most useful Chrome DevTools features, particularly beneficial for web developers in coding. If you’re interested in discovering more about DevTools, be sure to visit the official DevTools page.