article thumbnail

How to Create an Infographic Map with Adobe Illustrator

We And The Color

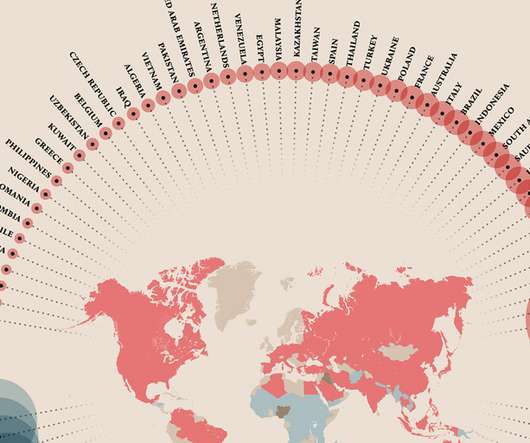
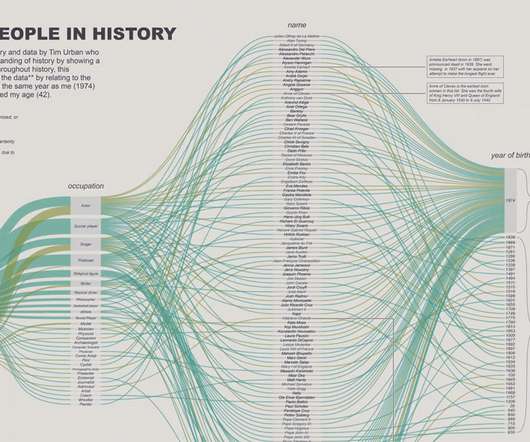
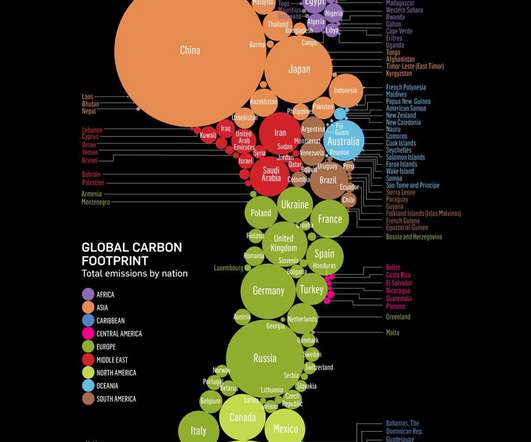
With this series of seven online courses by PaadĂ­n, you can learn step-by-step how to create a detailed infographic map using Adobe Illustrator. Thematic infographic maps are one of the most comprehensive types of infographics because they not only tell us where something is happening but also what and how.

article thumbnail

Online Course: Learn Illustrated Infographics

We And The Color

Learn illustrated infographics with this online course by Jing Zhang. Jing Zhang is one of the top names in the world of illustrated infographics. In this highly recommended online course, Jing Zhang will show you how to create an infographic that is both informative and visually pleasing at the same time.

Insiders

Sign Up for our Newsletter

This site is protected by reCAPTCHA and the Google Privacy Policy and Terms of Service apply.

article thumbnail

Infographic Set for Adobe Illustrator

We And The Color

Available for free download with an Adobe Stock trial subscription, this set of eye-catching infographics is fully customizable. Graphic designer and Adobe Stock contributor @Hermin Utomo created this beautifully designed infographic set. Subscribe to our newsletter!

article thumbnail

7 Graphic Design Trends of 2021 Every Designer Should Know – [Infographic]

Noupe

There was a time when bright colors and bold typography dominated the design world. But graphic design as we know it is ever-evolving. What worked a year ago may no longer be as effective today, making it important for designers to keep up with the latest trends. What does 2021 have in store for graphic design, you ask?

article thumbnail

Pattern Matters: Tangible Paper Infographic #infographic

Designspiration

Discover more of the best Infographics, Infographs, Data Visualization, Graphic Design, and Illustrations inspiration on Designspiration Saved by Anton Rhoden (@almr1226).

article thumbnail

Learn Information Design: Infographic Storytelling in Adobe Illustrator

We And The Color

In this course, you’ll learn how to turn data into beautiful and easy-to-understand infographics. As writing and storytelling, data design is an integral way to communicate information in a digestible, visually-appealing way that encourages the viewer to learn more. Take the course at Domestika. Take the course at Domestika.

article thumbnail

Download a Business-Themed Infographic Set on Adobe Stock

We And The Color

Available for free download with an Adobe Stock trial subscription, this template is exactly what you need to create eye-catching infographics for your business. Adobe Stock contributor @Petr has designed this massive collection of business-themed infographics. This business-themed infographic set is available here.